Meet the toolkit
Lecture 2
January 25, 2024
Announcements
Discussion sections merging
- Sections 201 and 202 (9:05am)
- Sections 205 and 206 (11:15am)
If you cannot access RStudio Workbench yet, email info2950@cornell.edu
Application exercises 00 are ungraded
Complete homework 00 in Canvas
![]()

R and RStudio
![]()
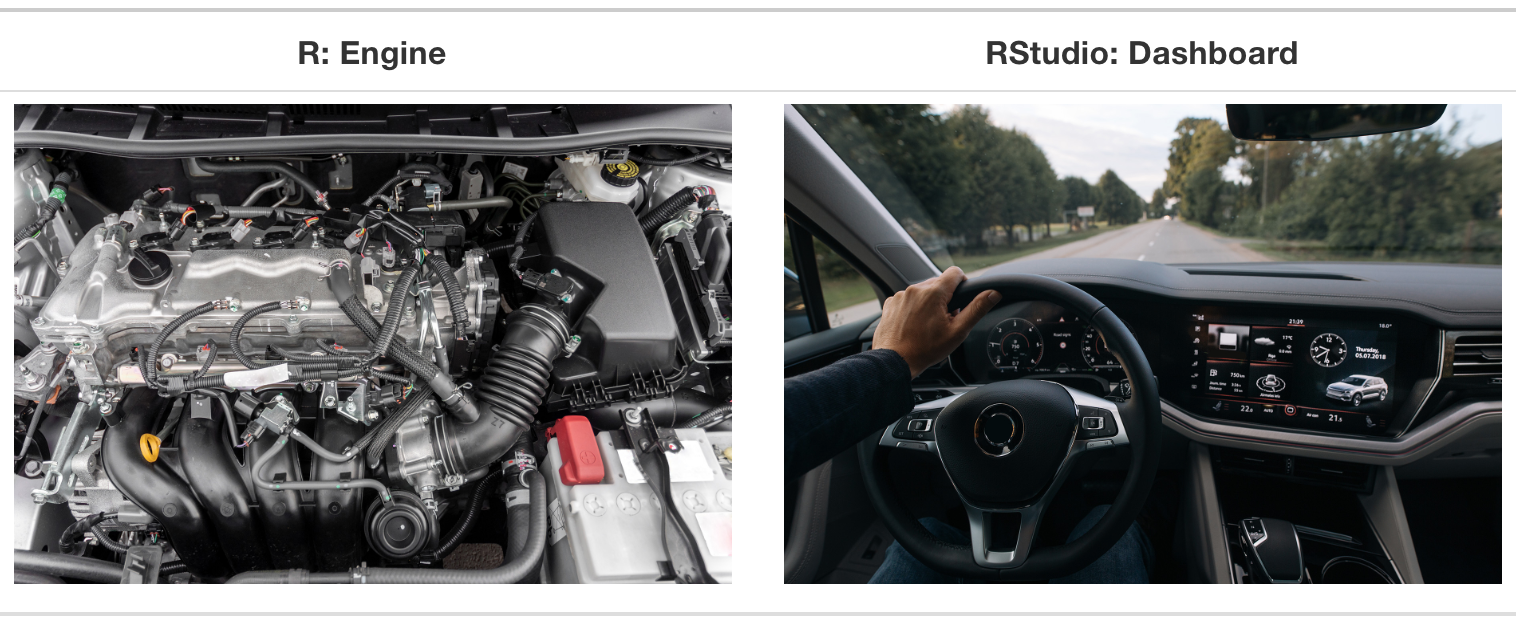
- R is an open-source statistical programming language
- R is also an environment for statistical computing and graphics
- It’s easily extensible with packages
![]()
- RStudio is a convenient interface for R called an IDE (integrated development environment), e.g. “I write R code in the RStudio IDE”
- RStudio is not a requirement for programming with R,1 but it’s very commonly used by R programmers and data scientists
R vs. RStudio
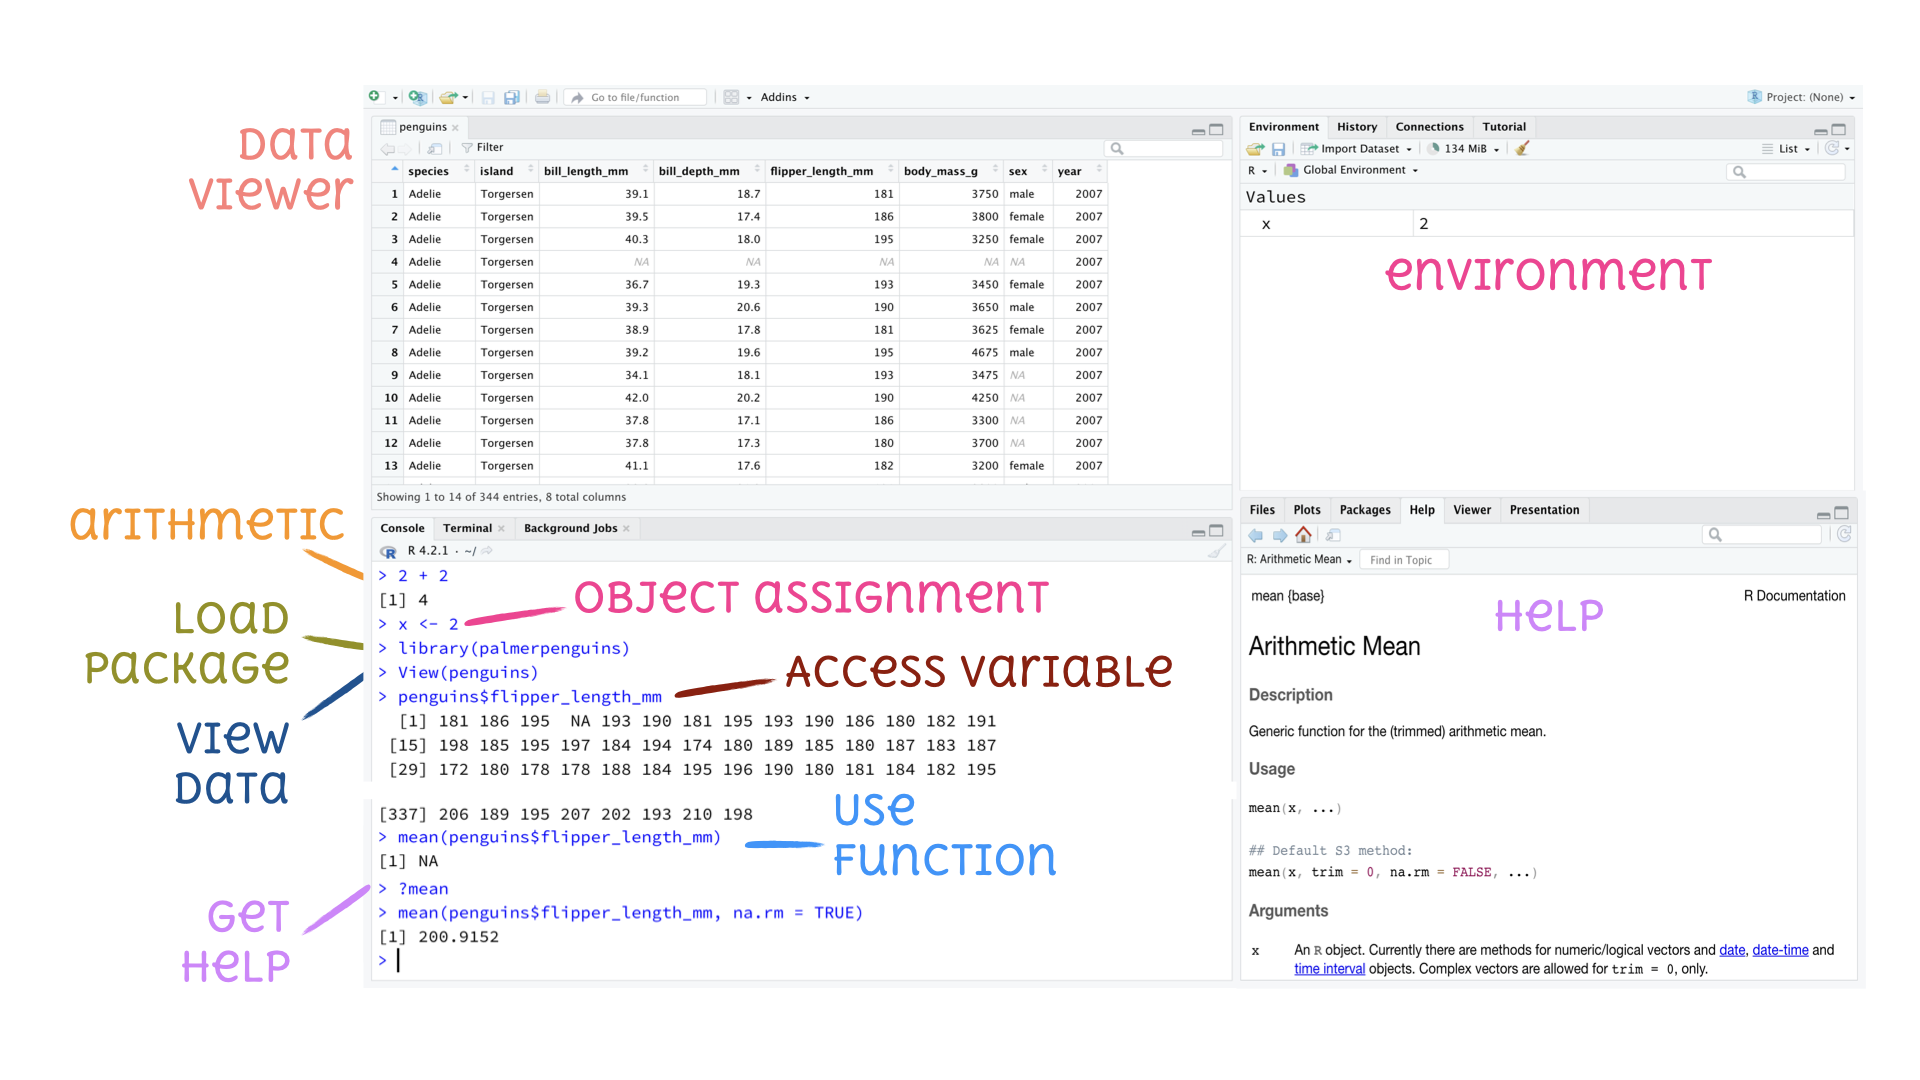
Tour: R and RStudio
tidyverse
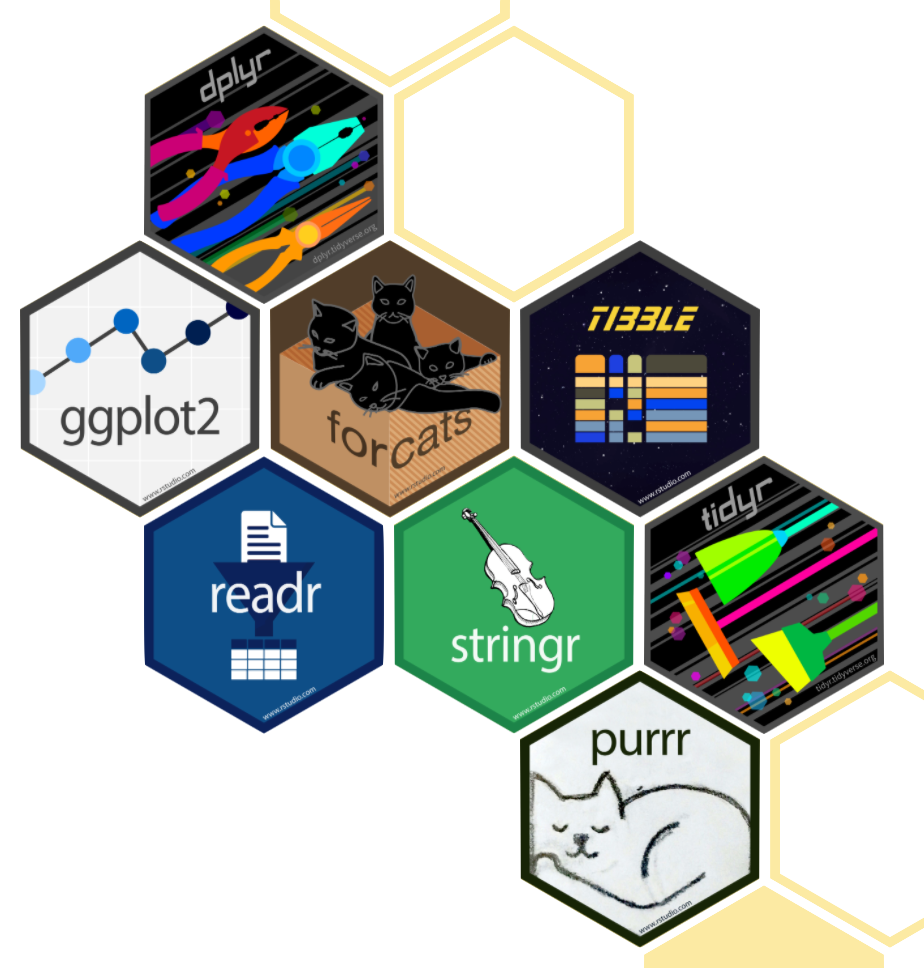
- The tidyverse is an opinionated collection of R packages designed for data science
- All packages share an underlying philosophy and a common grammar
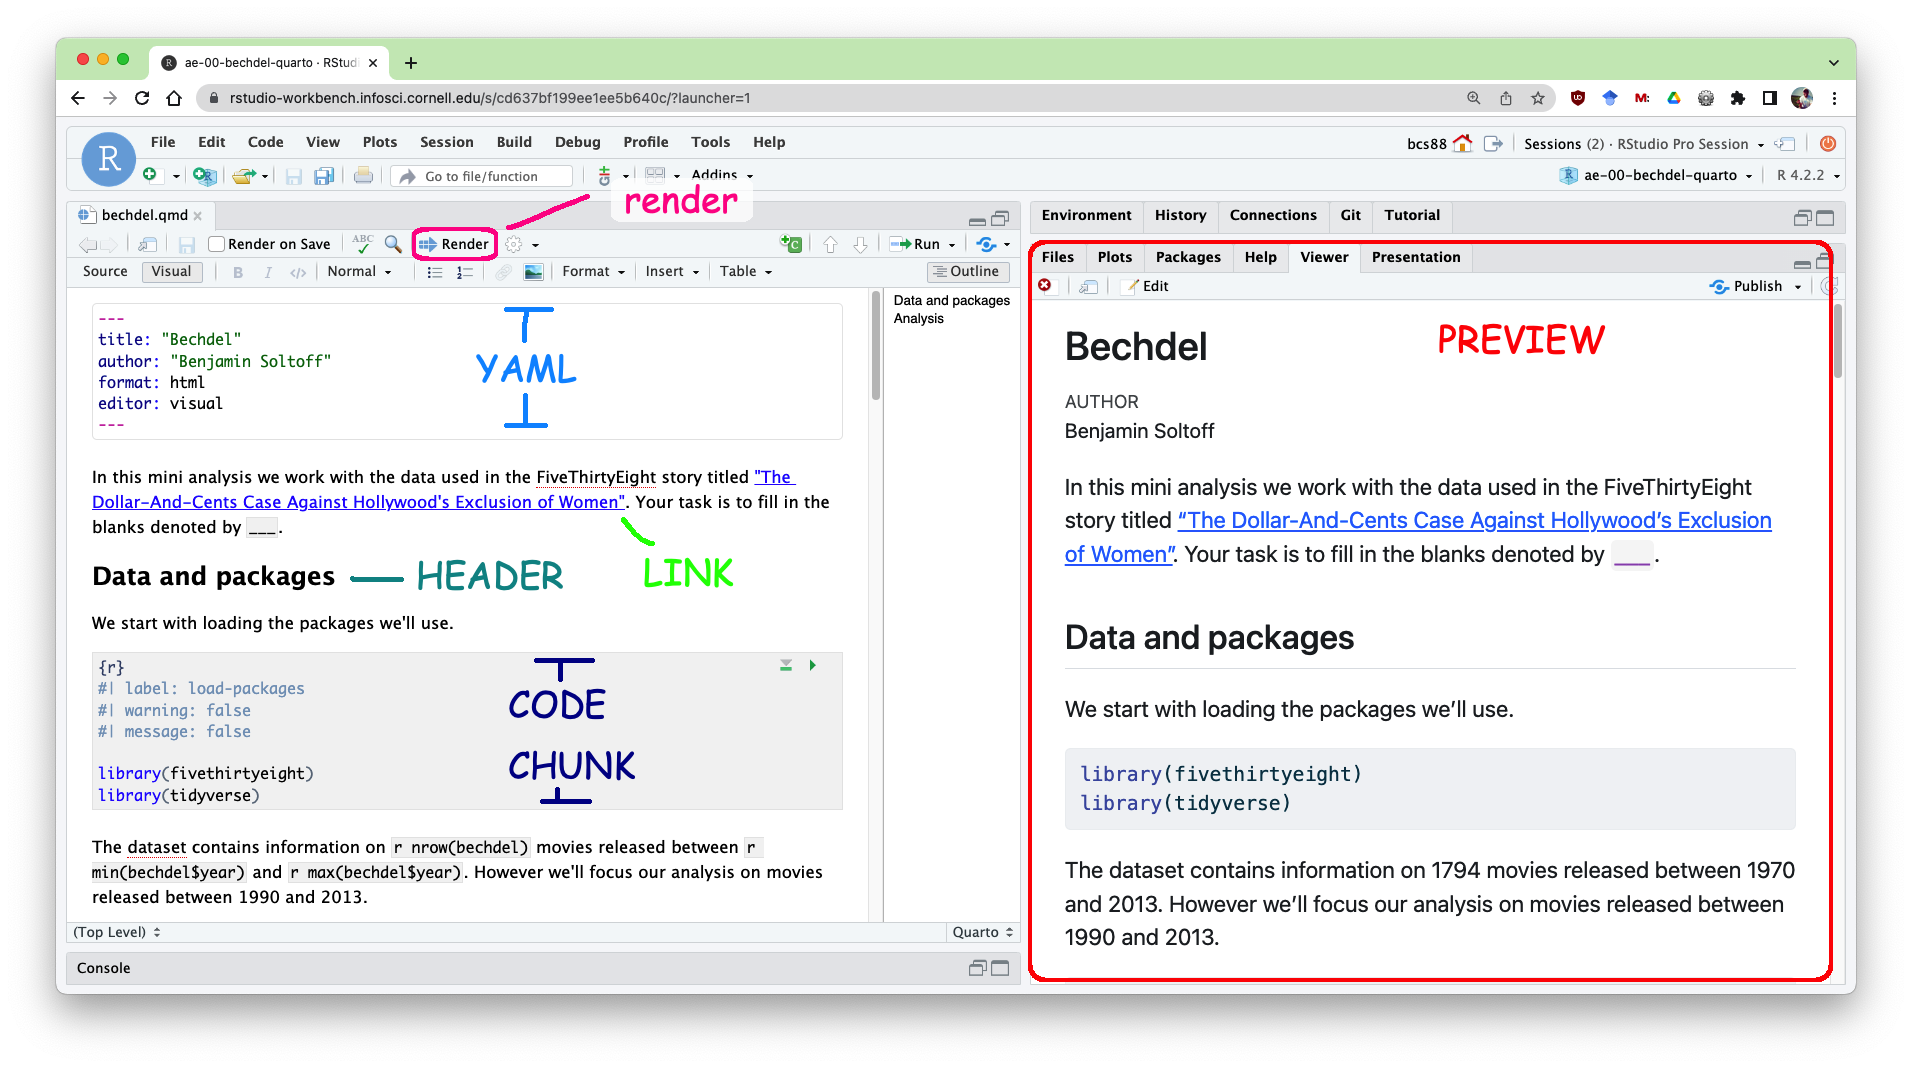
Tour: Quarto
The Bechdel test
In order to pass the test, a movie must have
- 👭 At least two named women in it
- 🗣️ Who talk to each other
- 🚫 About something besides a man

The Bechdel test

Git and GitHub
![]()
- Git is a version control system – like “Track Changes” features from Microsoft Word, on steroids
- It’s not the only version control system, but it’s a very popular one
![]()
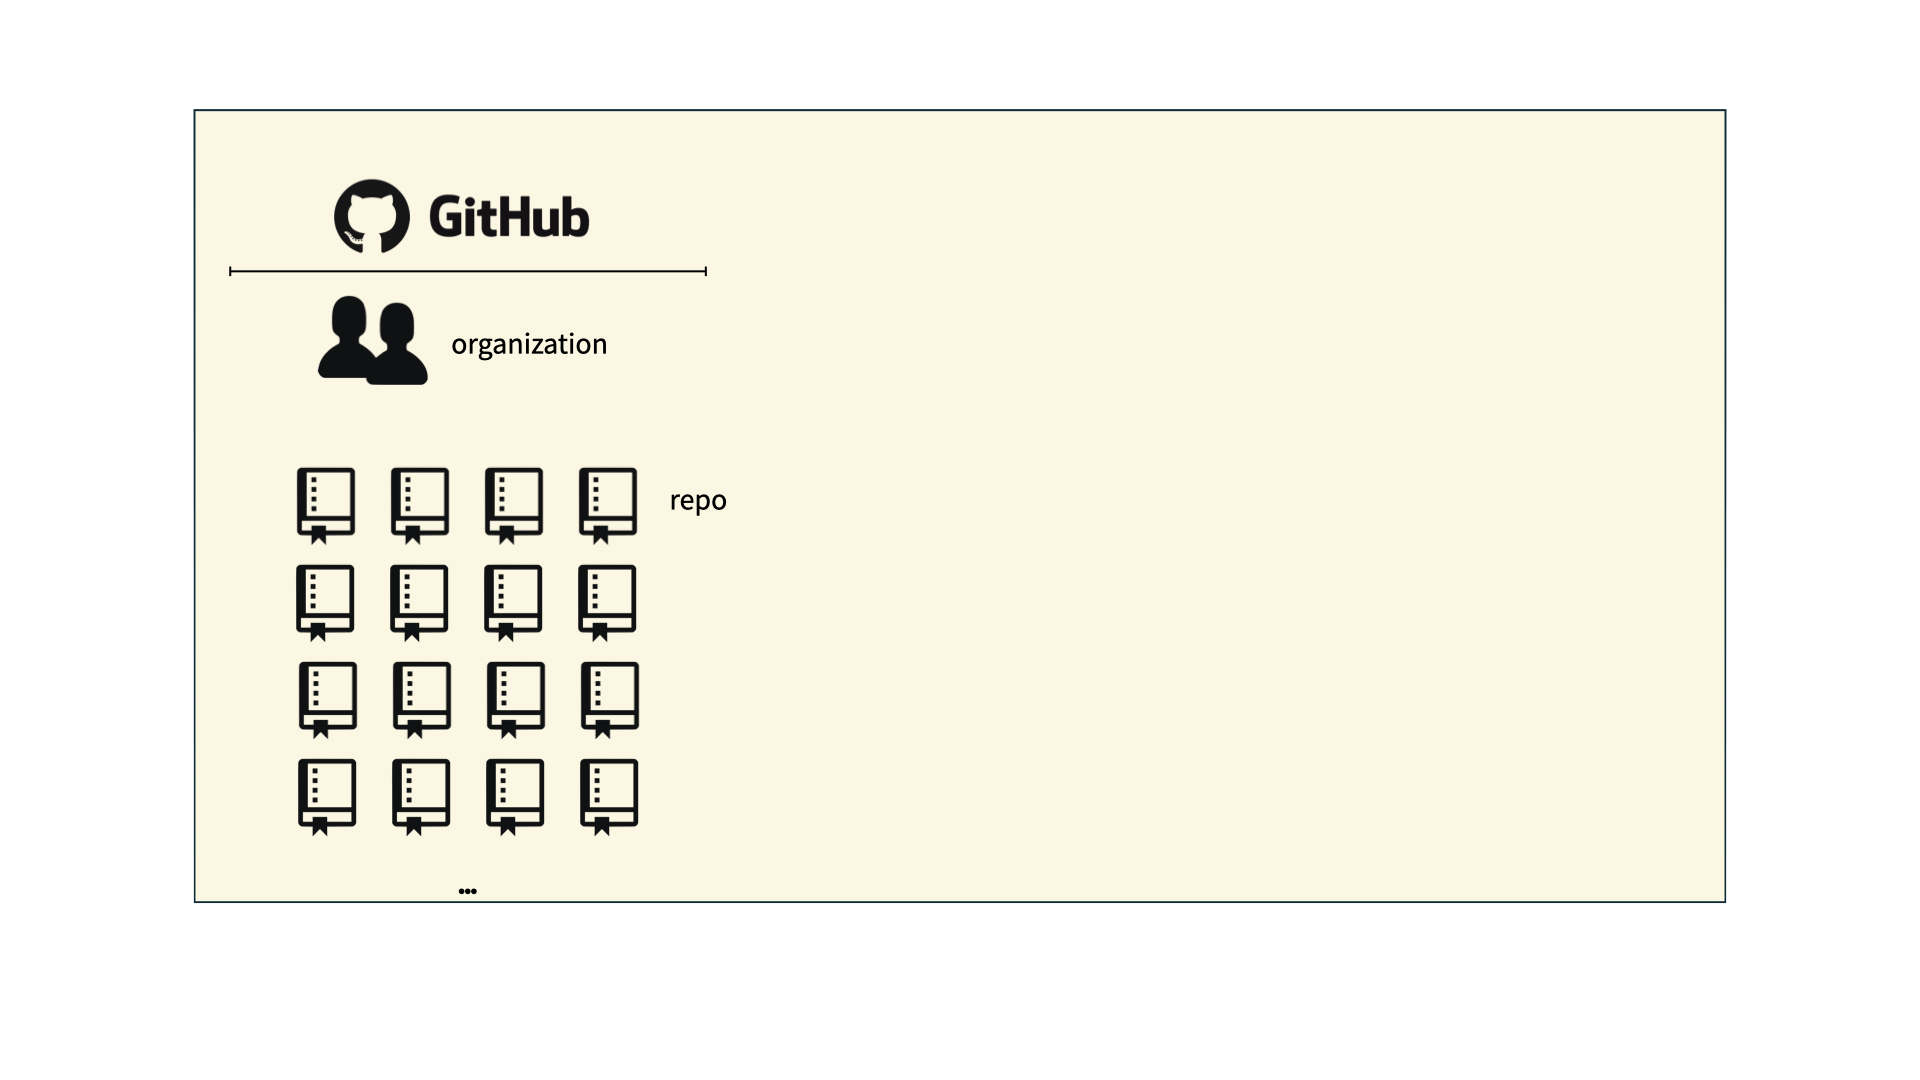
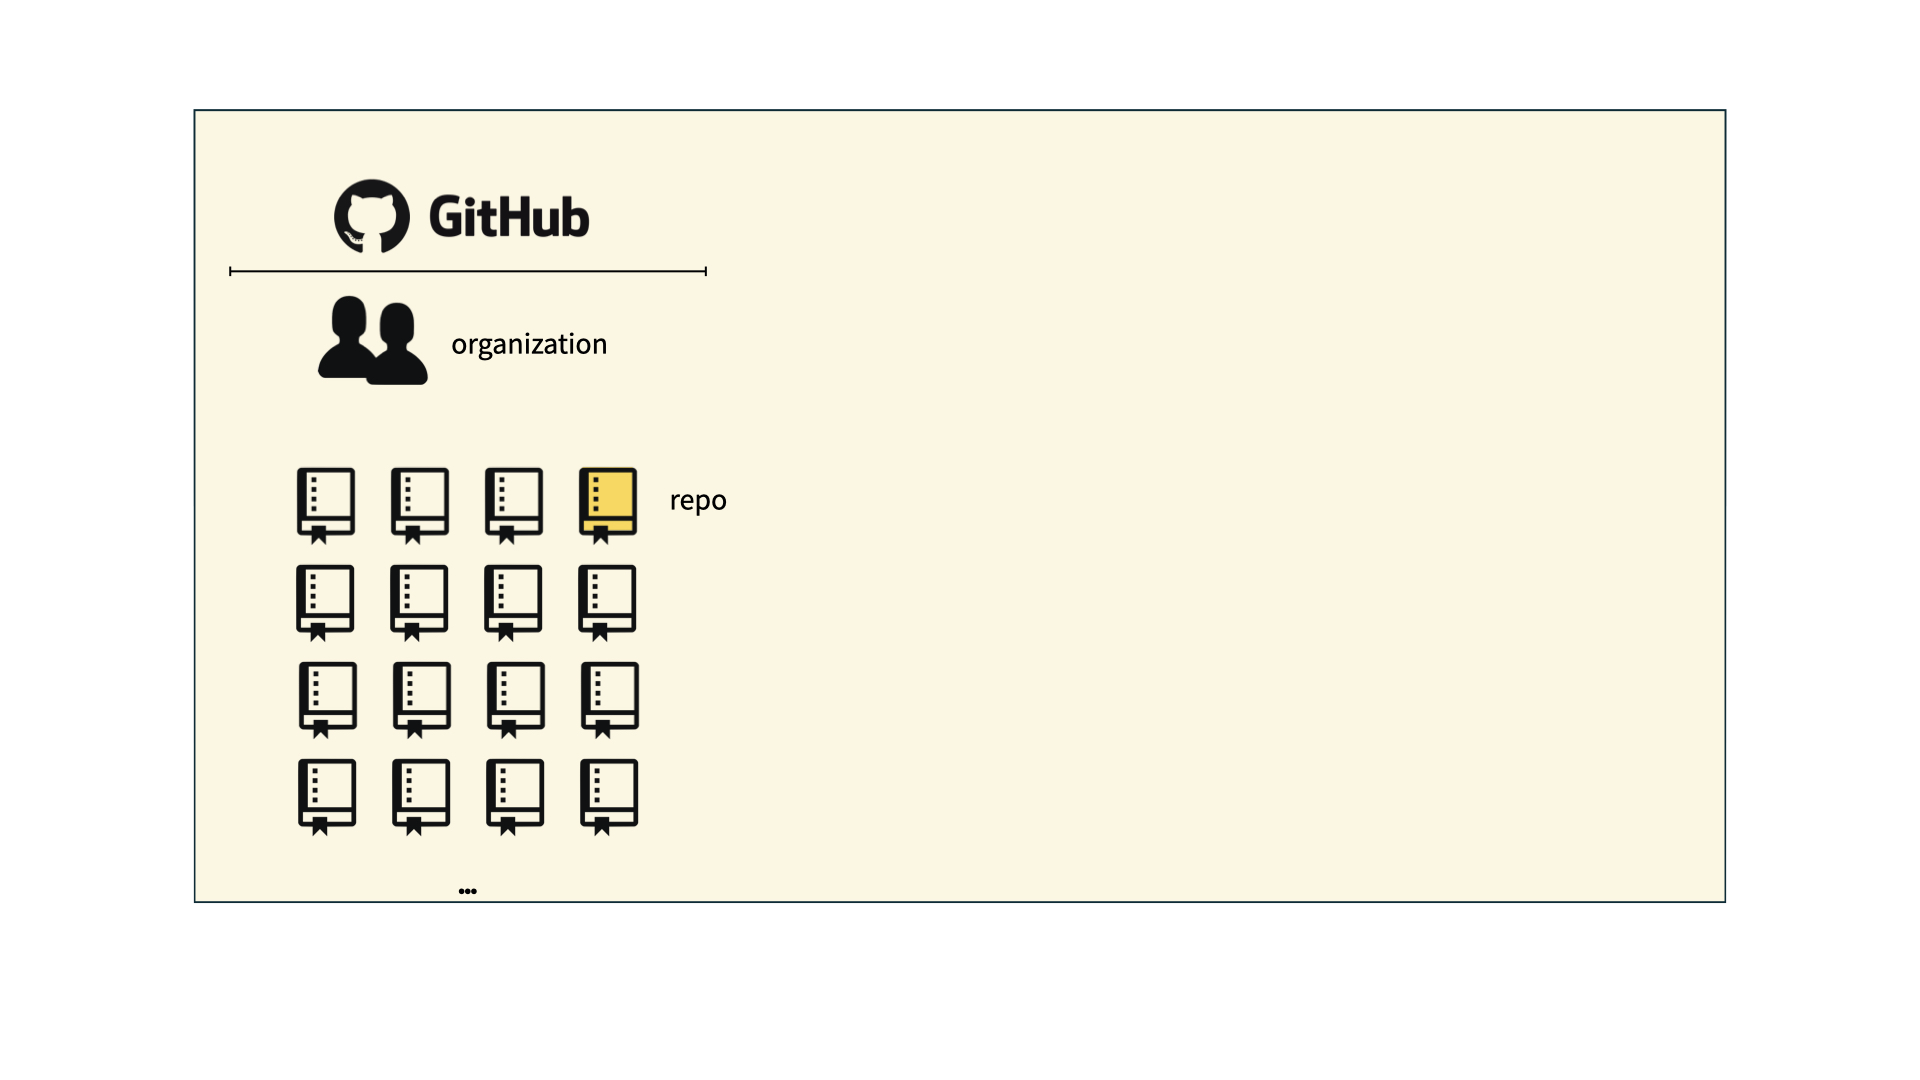
GitHub is the home for your Git-based projects on the internet – like DropBox but much, much better
We will use GitHub (Enterprise) as a platform for web hosting and collaboration
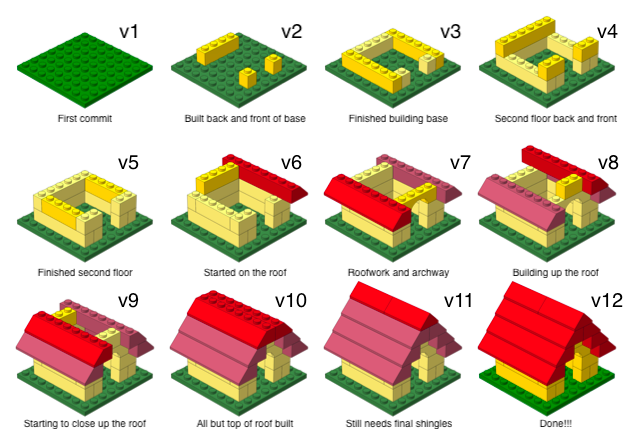
Versioning

Versioning
with human readable messages
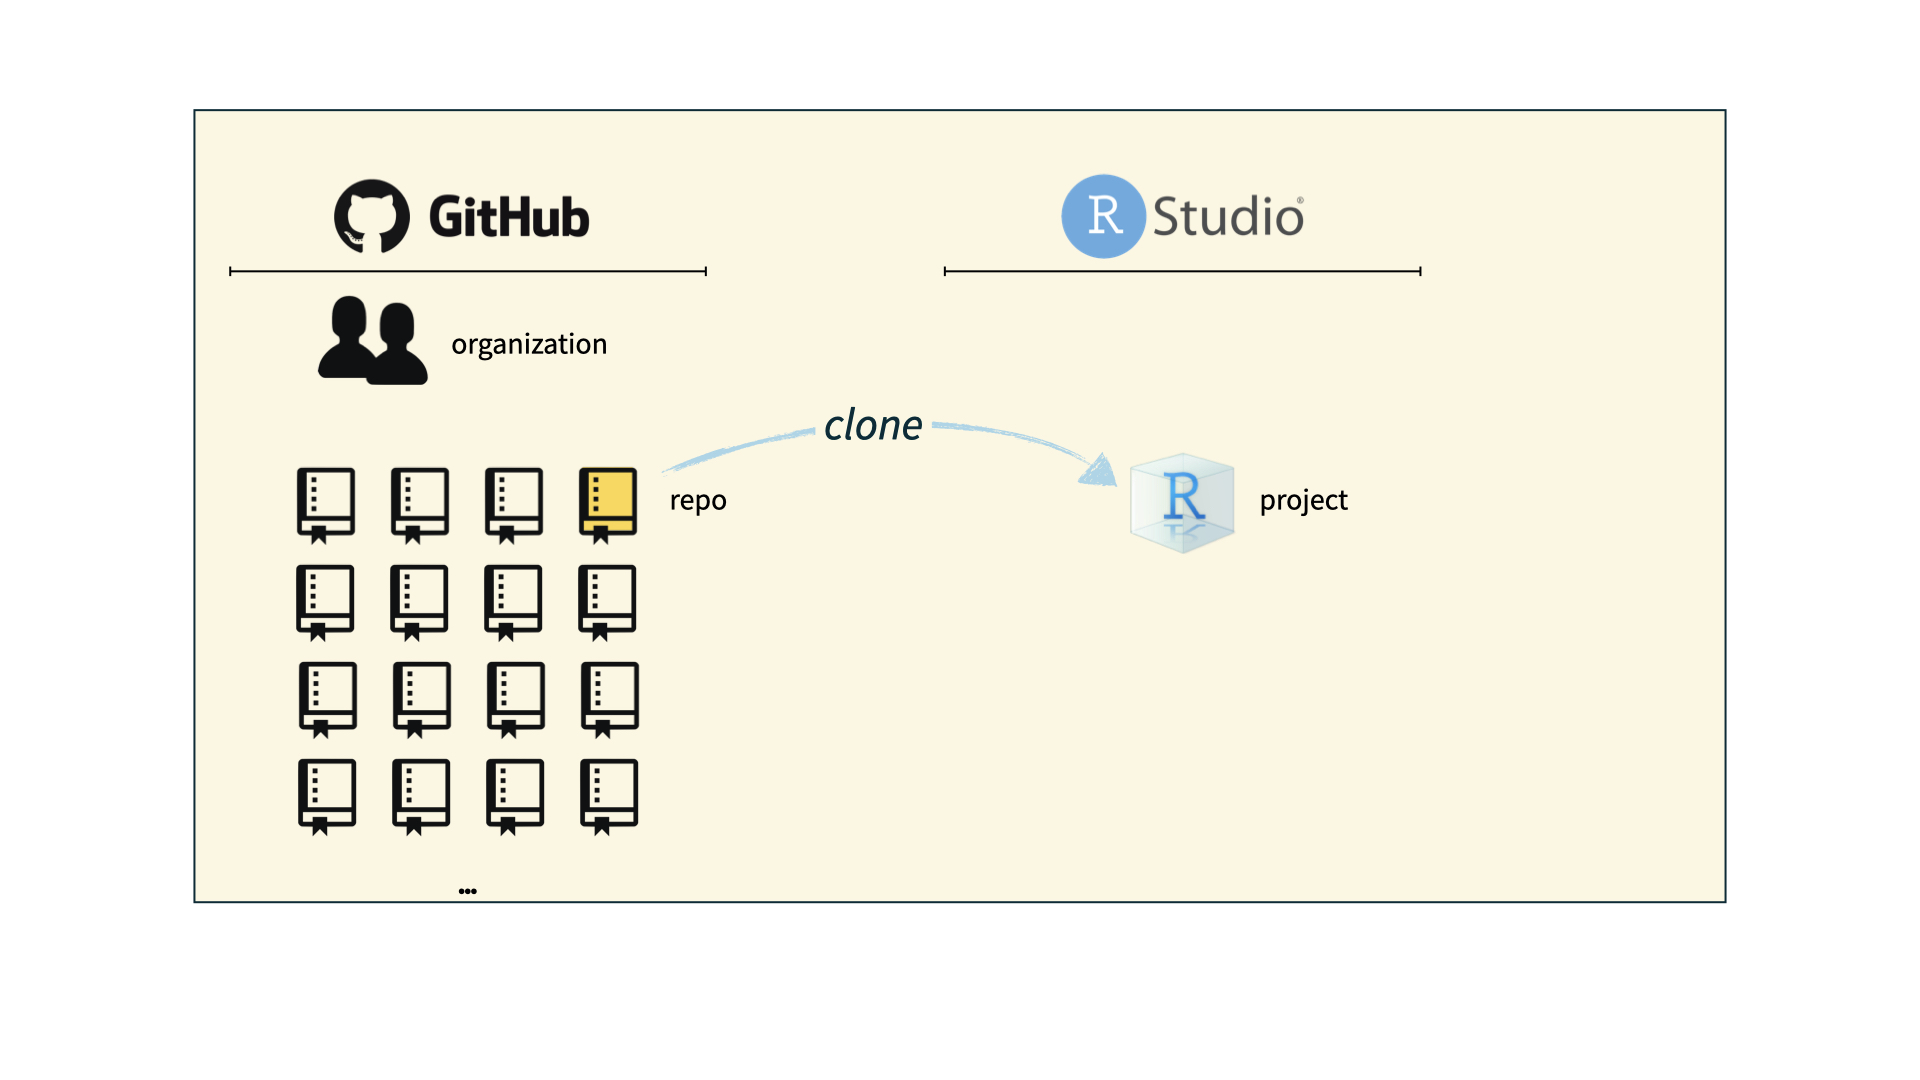
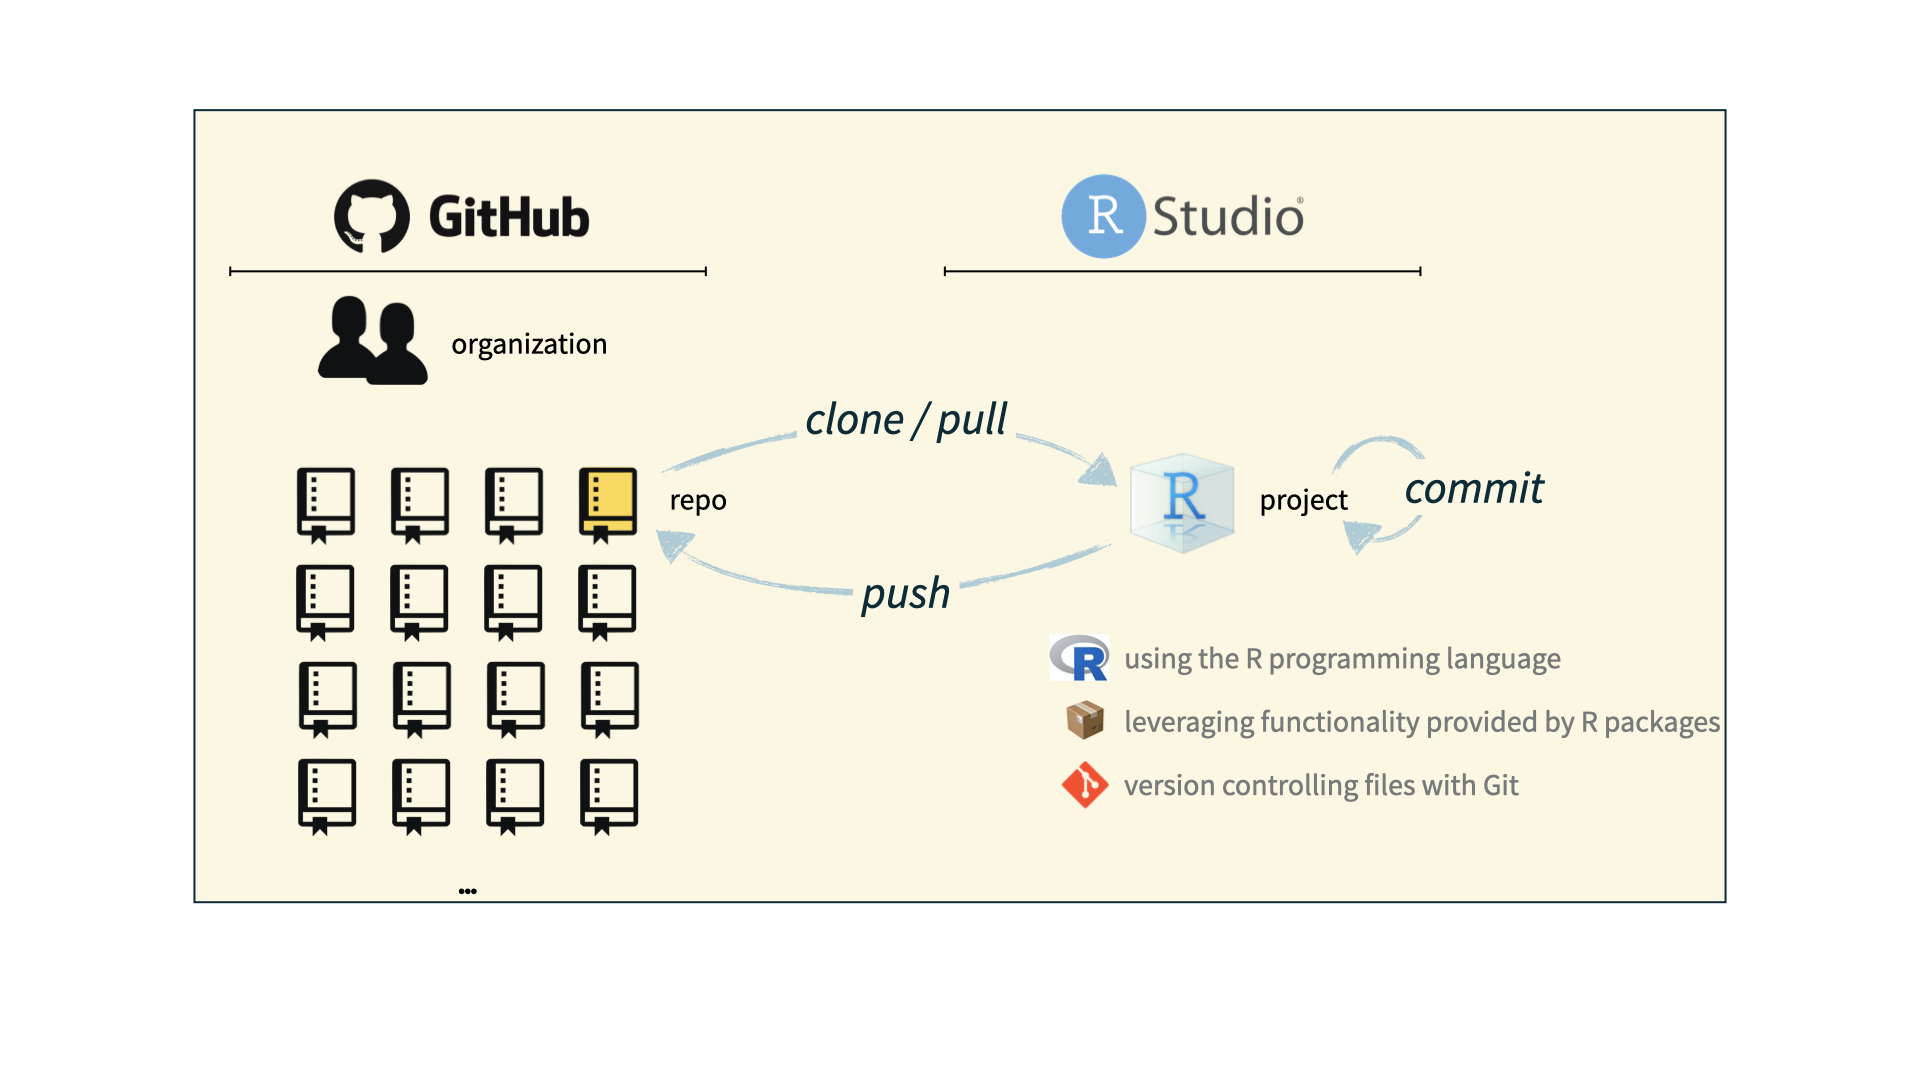
How we use Git and GitHub

Avatar