The grammar of graphics

Lecture 3

Dr. Benjamin Soltoff

Cornell University
INFO 2950 - Spring 2024

January 30, 2024

Announcements

Announcements

  • Lab 00 due last night
  • Lab 00 will not count towards your final grade - practice with the workflow and rubrics only
  • All assignments from here on out will be graded
  • “Graded” AEs – commit and push to your repo by 11:59pm tomorrow

Warm up

Examining data visualization

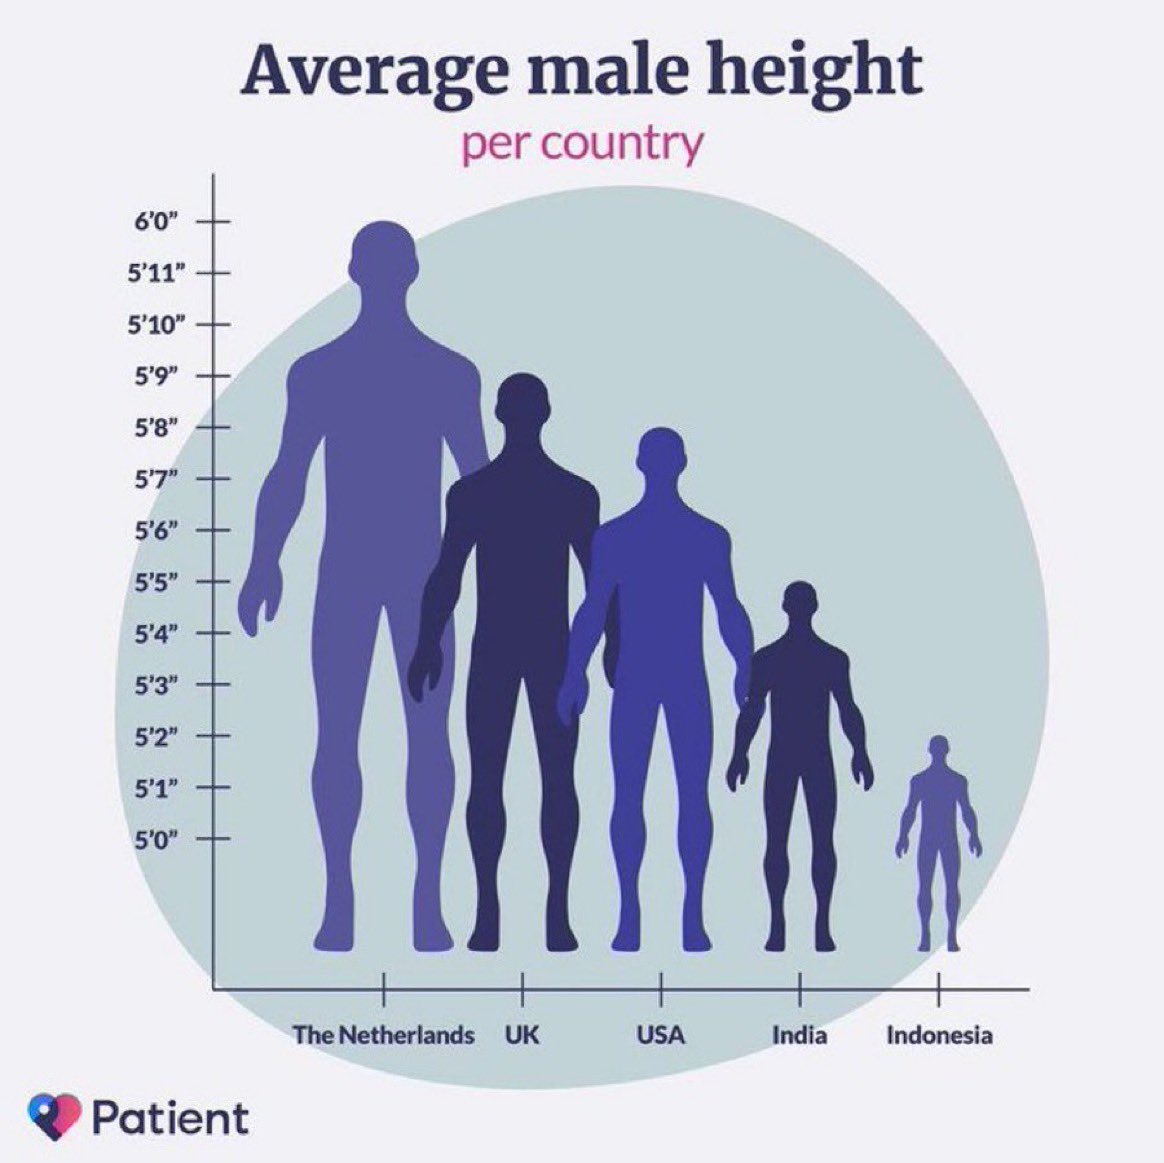
Discuss the following for the visualization

  • What is the visualization trying to show?

  • What is effective, i.e. what is done well?

  • What is ineffective, i.e. what could be improved?

  • What are you curious about after looking at the visualization?

02:00

Source: Twitter

Application exercise

The Bechdel Test

ae-01

  • Go to the course GitHub org and find your ae-01 (repo name will be suffixed with your NetID).
  • Clone the repo in RStudio Workbench, open the Quarto document in the repo, and follow along and complete the exercises.
  • Render, commit, and push your edits by the AE deadline – end of tomorrow.

Recap of AE

  • Construct plots with ggplot().
  • Components of ggplots are separated by +s.
  • The formula is (almost) always as follows:
ggplot(data = DATA, mapping = aes(x = X-VAR, y = Y-VAR, ...)) +
  geom_XXX()
  • Aesthetic attributes of a geometries (color, size, transparency, etc.) can be mapped to variables in the data or set by the user, e.g. color = binary vs. color = "pink".
  • Use facet_wrap() when faceting (creating small multiples) by one variable and facet_grid() when faceting by two variables.

Into the Maasverse

Cover of House of Flame and Shadow by Sarah J Maas