Visualizing various types of data
Lecture 4
Dr. Benjamin Soltoff
Cornell University
INFO 2950 - Spring 2024
February 1, 2024
Announcements
Announcements
- Lab 01 tomorrow
- Homework 01 due next week
Warm up
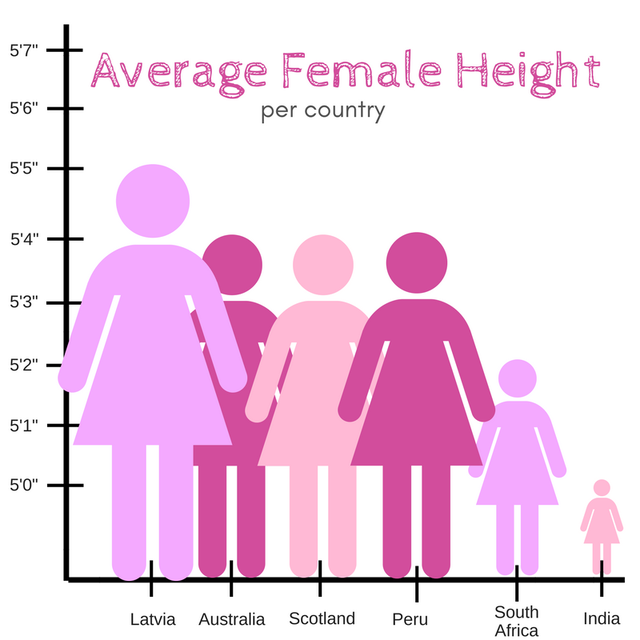
Revisiting average heights

The way data is displayed matters
What do these plots show?


Application exercise
Prognosticator of prognosticators
ae-02
- Go to the course GitHub org and find your
ae-02(repo name will be suffixed with your GitHub name). - Clone the repo in RStudio Workbench, open the Quarto document in the repo, and follow along and complete the exercises.
- Render, commit, and push your edits by the AE deadline – end of tomorrow.
Recap of AE
- Pick geoms based on data types.
- Set appropriate binwidths for histograms.
- Turn off legends when they provide redundant information with
show.legend = FALSE. - Create plots with multiple geoms, and pay attention to order.
Happy birthday!
