Tidying data 🥞

Lecture 7

Dr. Benjamin Soltoff

Cornell University
INFO 2950 - Spring 2024

February 13, 2024

Announcements

Regrade requests

  • Submit starting at noon the day after the assignment grade is published
  • Due within one week of the assignment grade being published
  • Regrade requests are for if you believe a mistake was made in grading your submission
  • Be specific and polite in your request. We all make mistakes. If we made a mistake grading your submission, we want to correct it.

Common questions at this point

  • What is the difference between rendering and saving a document?

    • Saving a Quarto file saves the changes in the source .qmd file but are not reflected in your output HTML or PDF file
    • When you render the document, the output is also updated to reflect those changes
    • When you click “render” RStudio automatically first saves your Quarto file, then renders it
    • Render early and often
      • Save changes
      • Identifies any errors early
  • What does it mean to commit and push something?

    • Commit stores a snapshot of the files in your local repository (i.e. the files save on the university server)
    • Push gets those changes to the remote repository (i.e. your repository on GitHub)

Tidying datasets

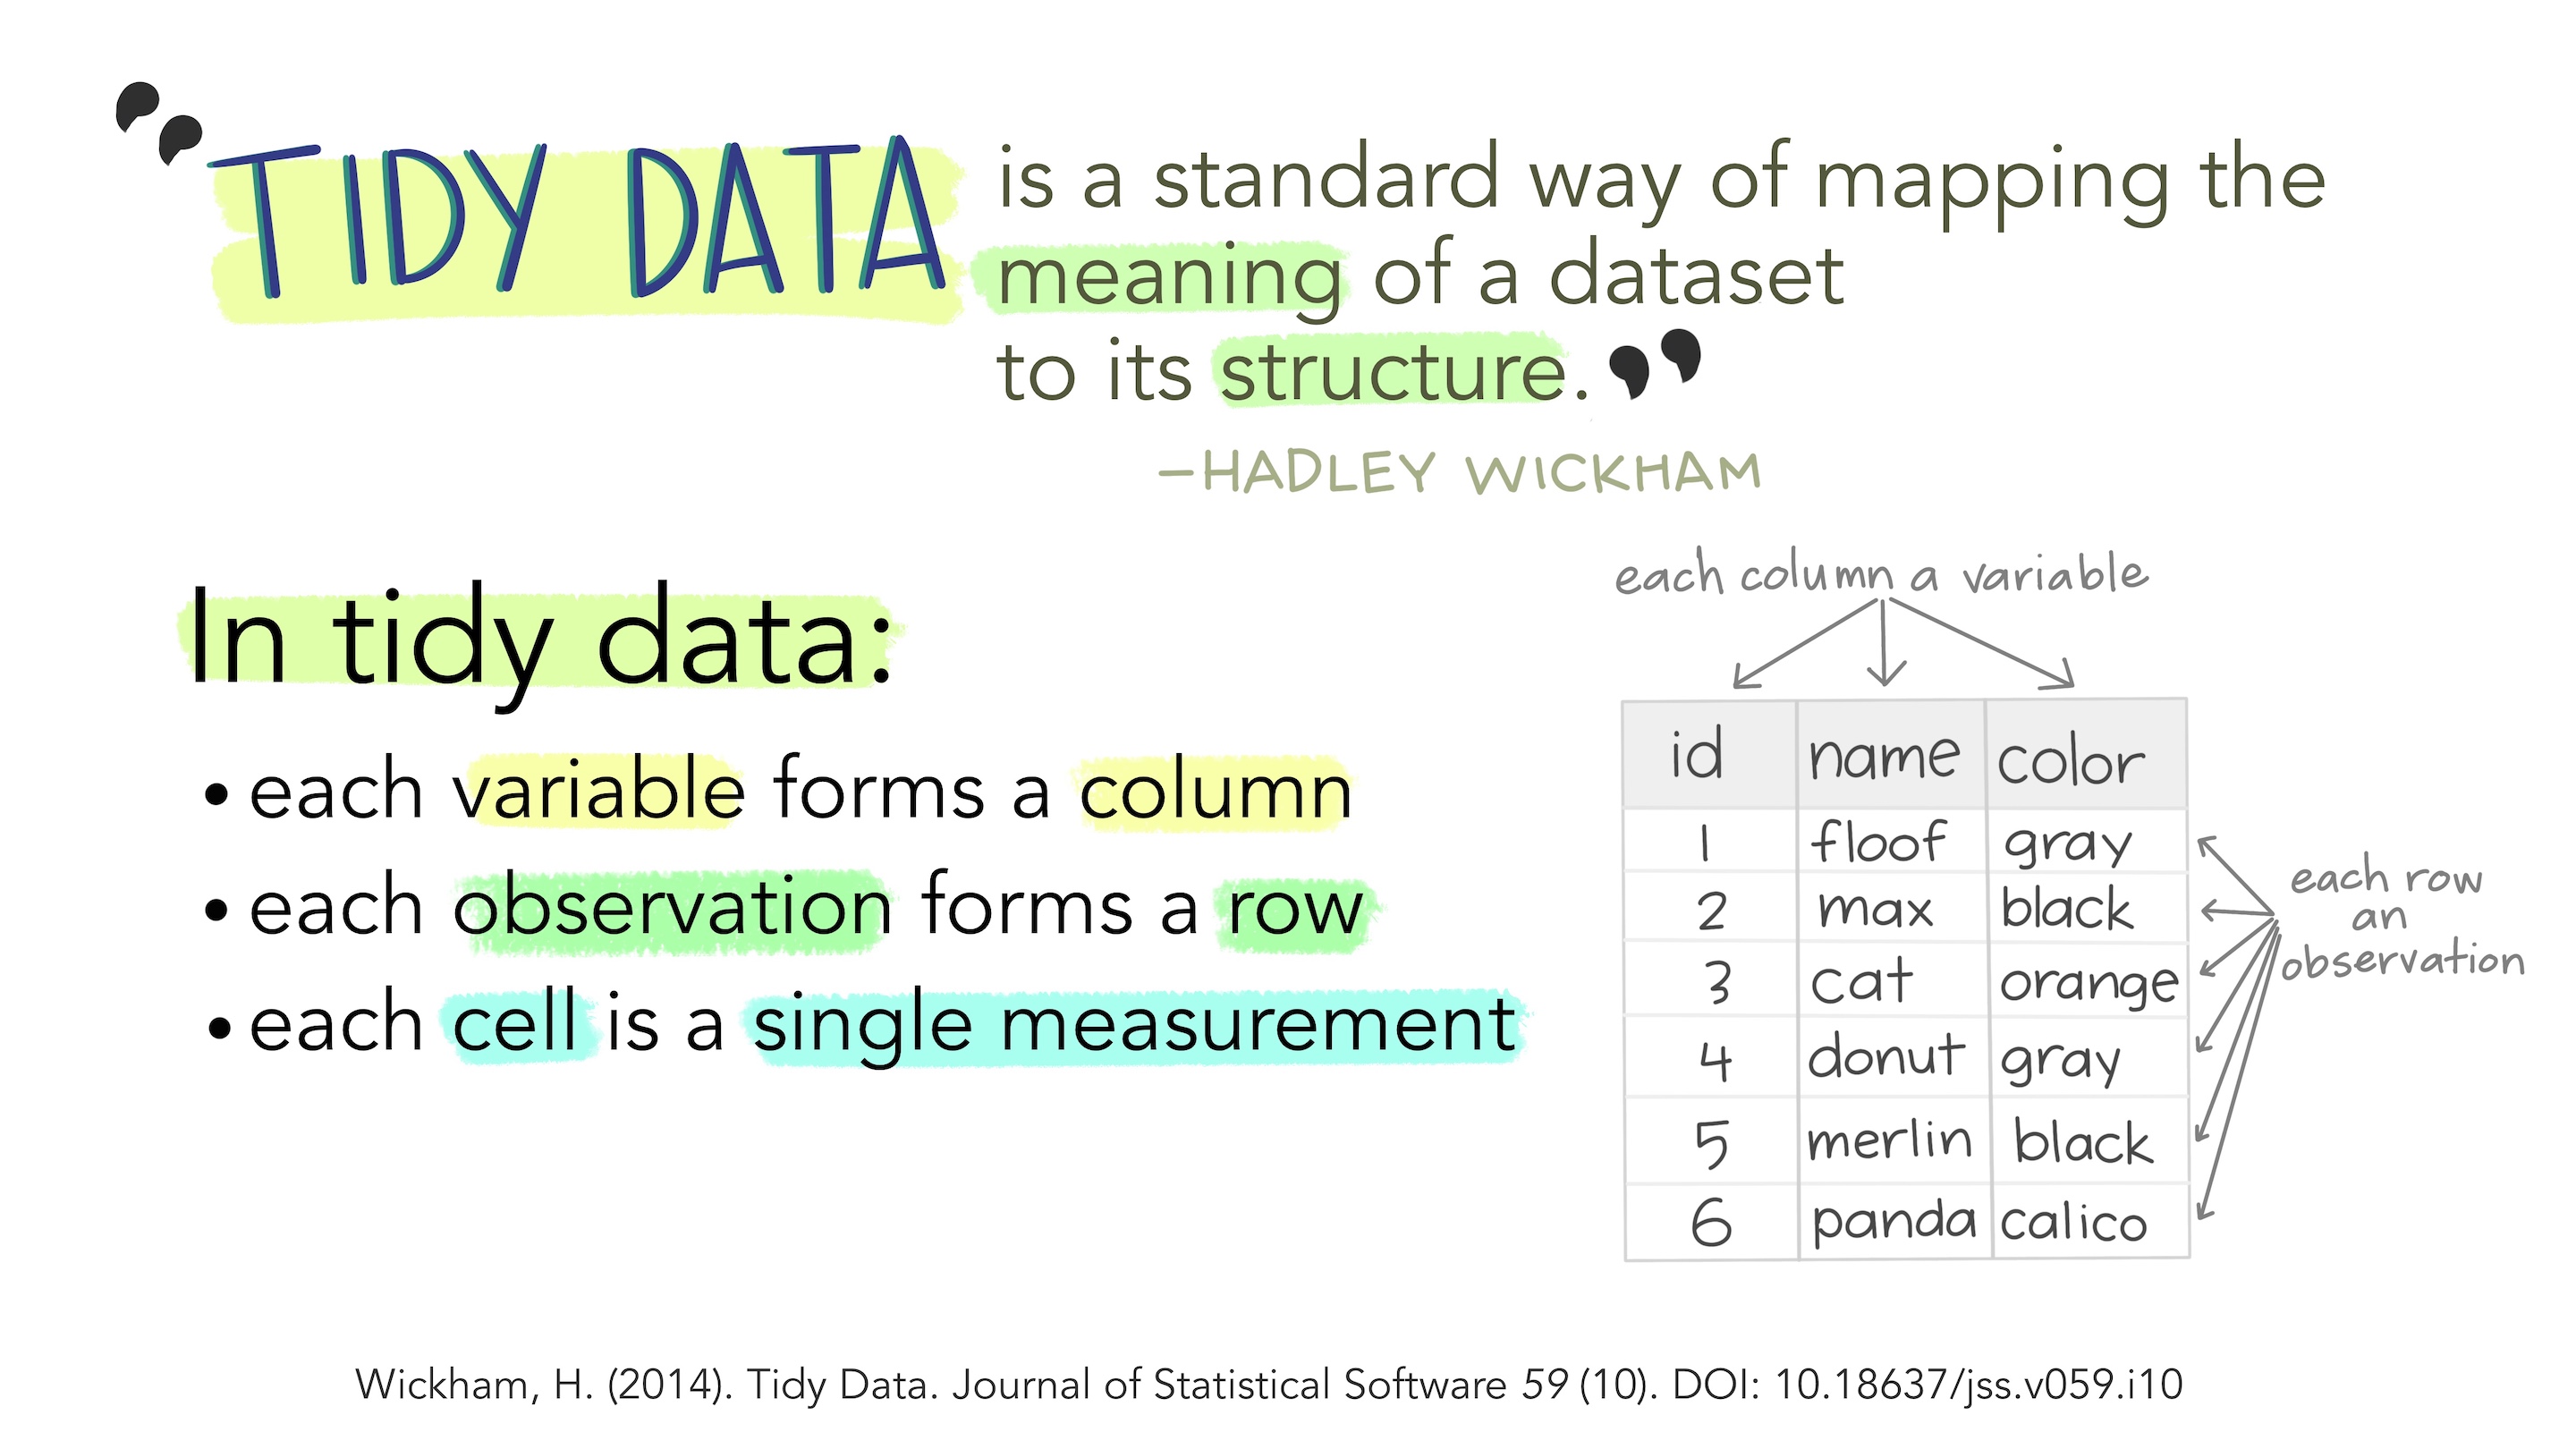
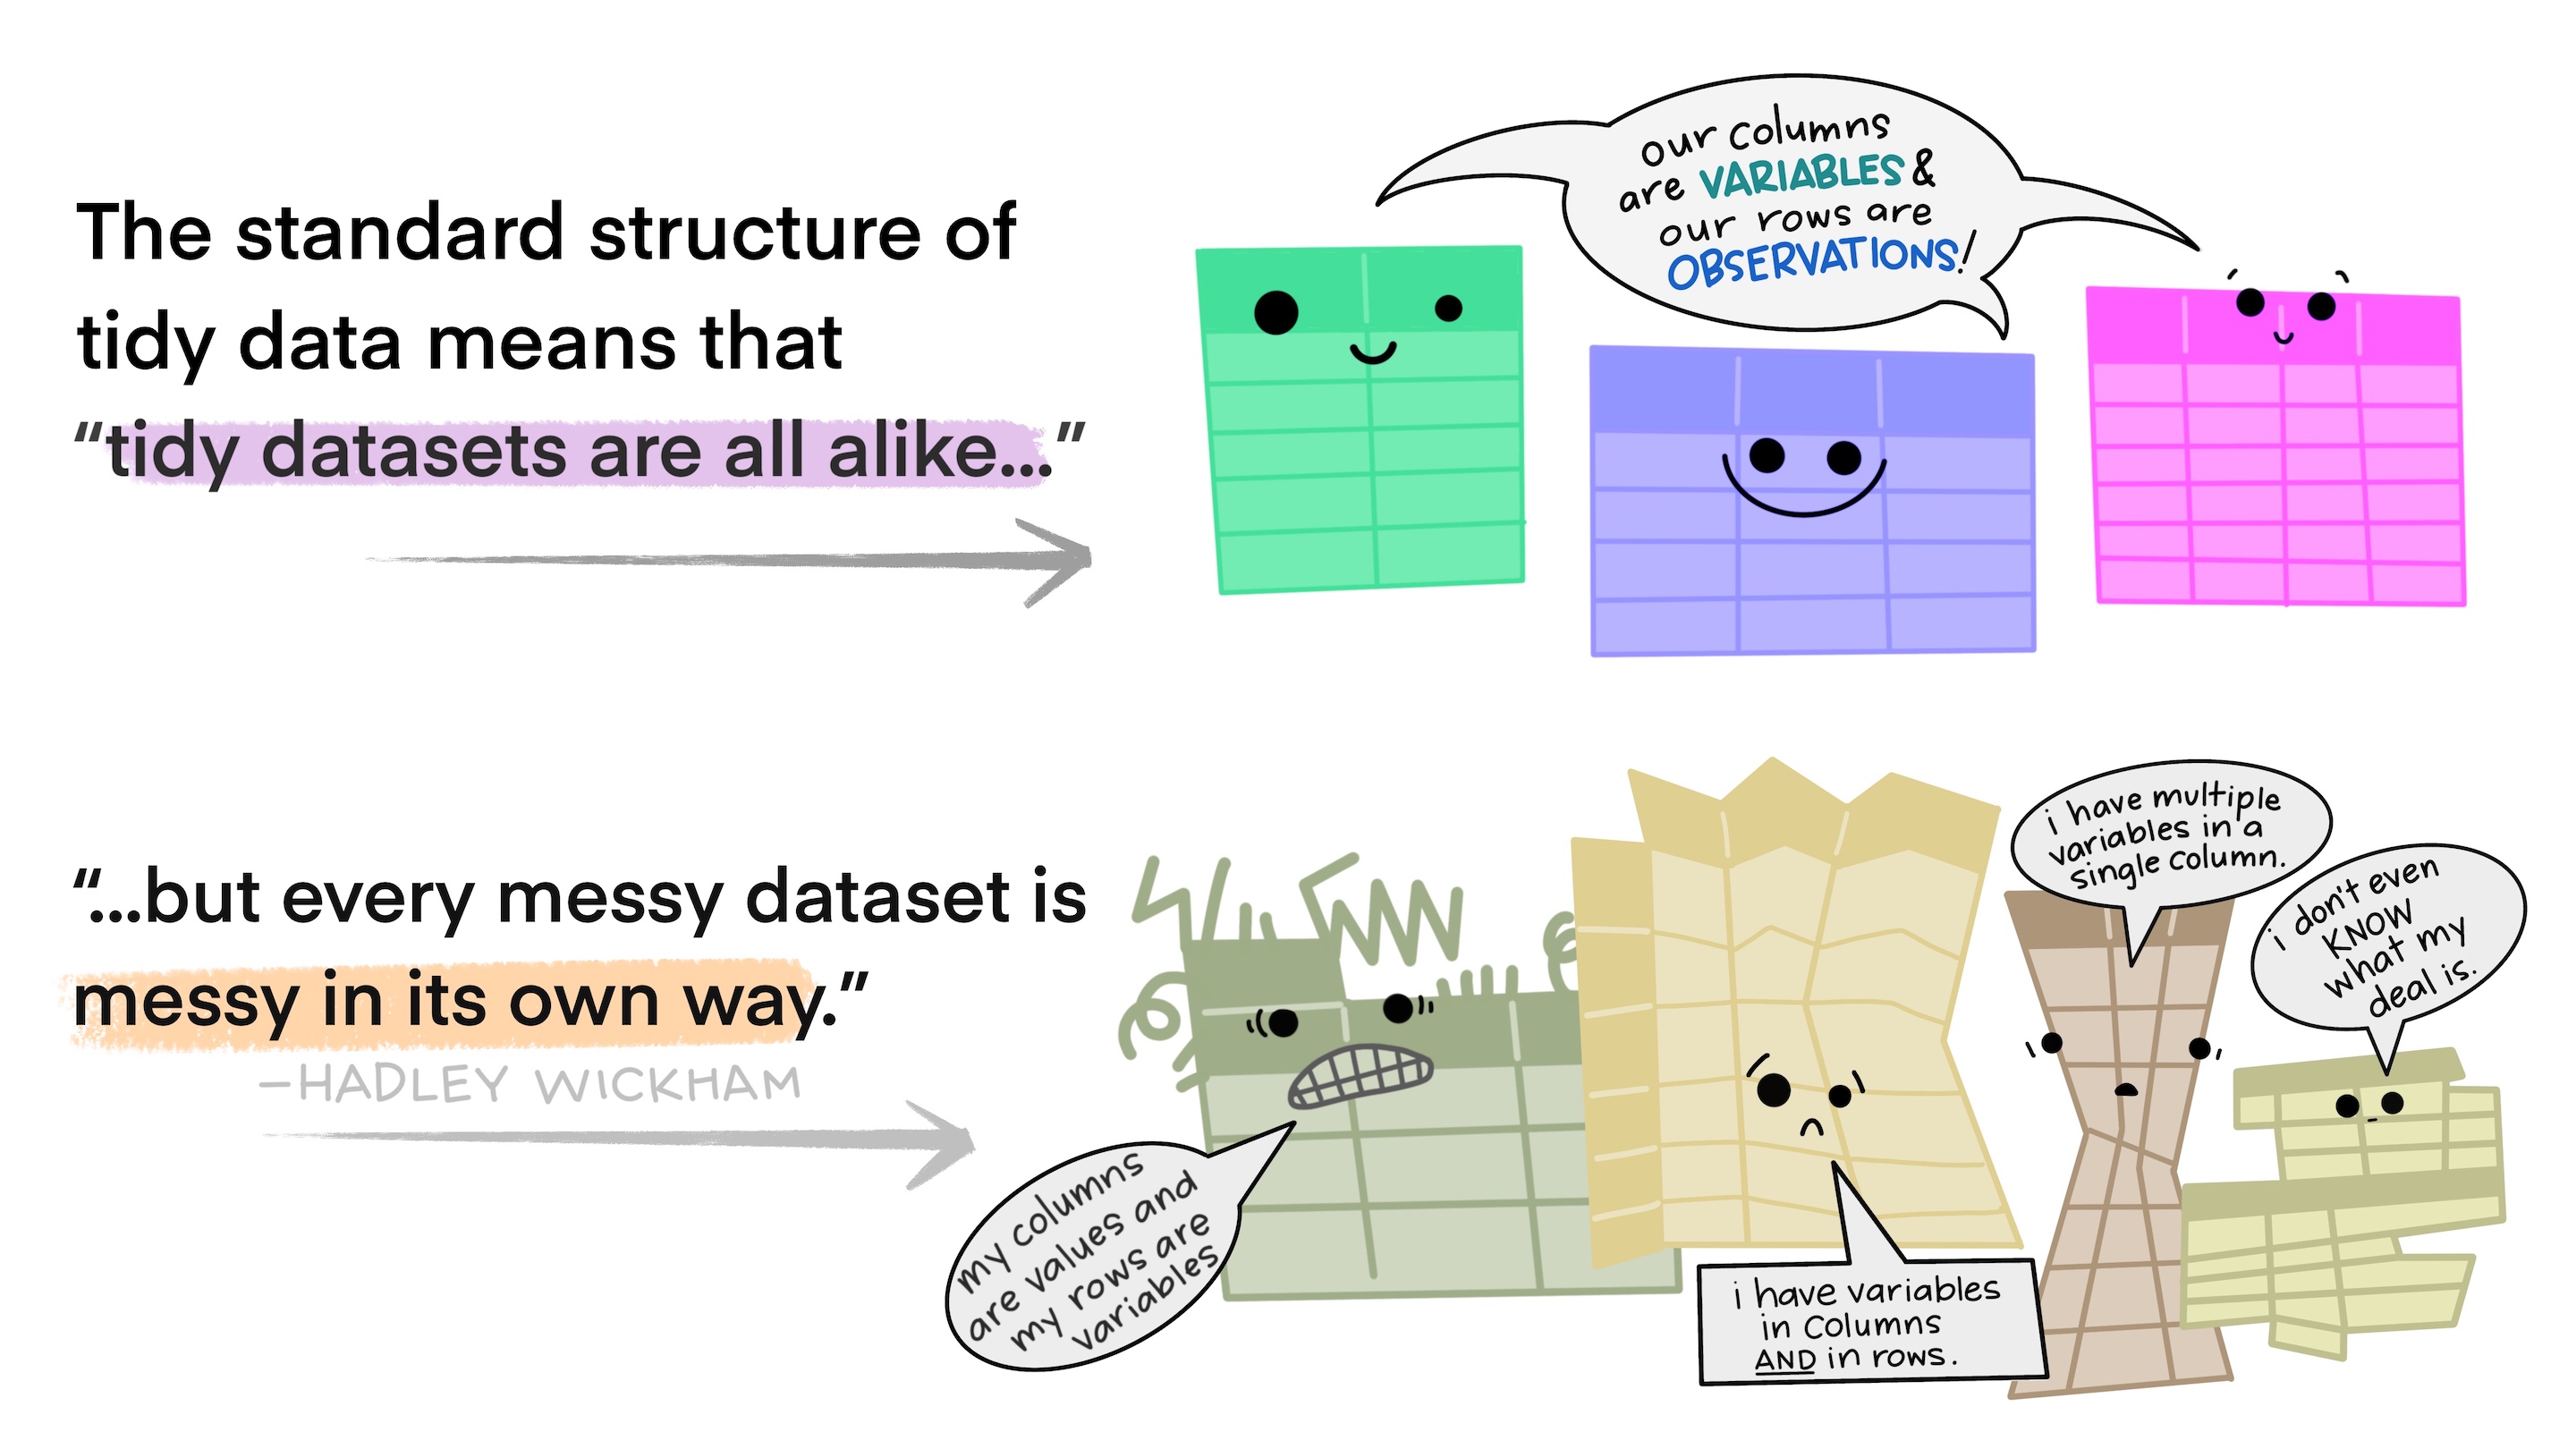
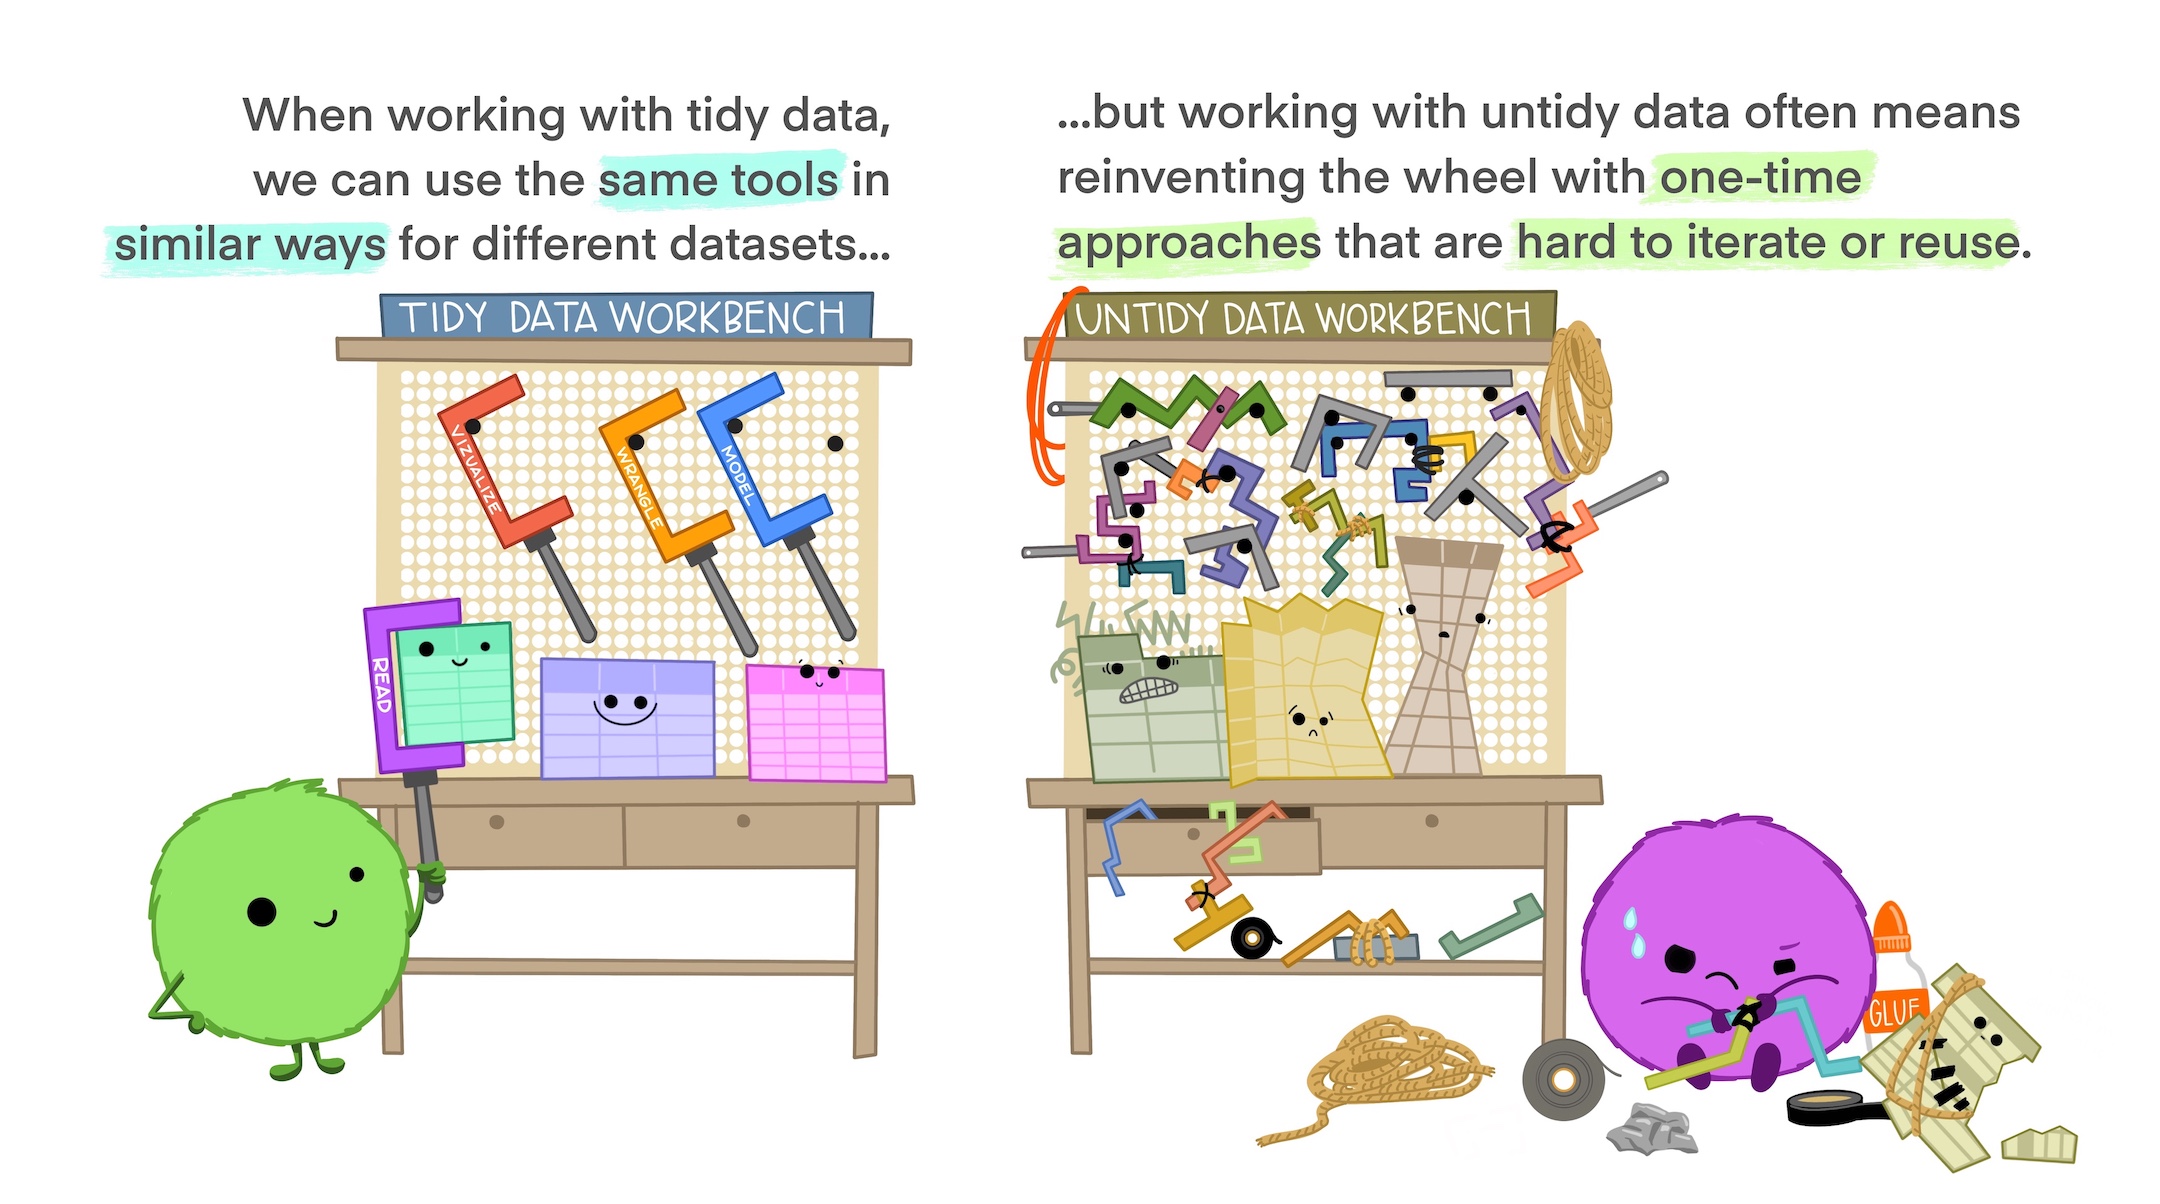
What makes a dataset “tidy”?

02:00

Stylized text providing an overview of Tidy Data. The top reads "Tidy data is a standard way of mapping the meaning of a dataset to its structure. - Hadley Wickham." On the left reads "In tidy data: each variable forms a column; each observation forms a row; each cell is a single measurement." There is an example table on the lower right with columns "id", "name" and "color" with observations for different cats, illustrating tidy data structure.

There are two sets of anthropomorphized data tables. The top group of three tables are all rectangular and smiling, with a shared speech bubble reading "our columns are variables and our rows are observations!". Text to the left of that group reads "The standard structure of tidy data means that "tidy datasets are all alike…" The lower group of four tables are all different shapes, look ragged and concerned, and have different speech bubbles reading (from left to right) "my column are values and my rows are variables", "I have variables in columns AND in rows", "I have multiple variables in a single column", and "I don"t even KNOW what my deal is." Next to the frazzled data tables is text "...but every messy dataset is messy in its own way. -Hadley Wickham."

On the left is a happy cute fuzzy monster holding a rectangular data frame with a tool that fits the data frame shape. On the workbench behind the monster are other data frames of similar rectangular shape, and neatly arranged tools that also look like they would fit those data frames. The workbench looks uncluttered and tidy. The text above the tidy workbench reads "When working with tidy data, we can use the same tools in similar ways for different datasets…" On the right is a cute monster looking very frustrated, using duct tape and other tools to haphazardly tie data tables together, each in a different way. The monster is in front of a messy, cluttered workbench. The text above the frustrated monster reads "...but working with untidy data often means reinventing the wheel with one-time approaches that are hard to iterate or reuse."

Digital illustration of a cute fuzzy monster holding a brief case that says "tidy data," standing beside a friendly looking data table character, being welcomed with cheers by many other data tables and another cute monster jumping with joy.

Digital illustration of two cute fuzzy monsters sitting on a park bench with a smiling data table between them, all eating ice cream together. In text above the illustration are the hand drawn words "make friends with tidy data."

Application exercise

ae-05

  • Go to the course GitHub org and find your ae-05 (repo name will be suffixed with your GitHub name).
  • Clone the repo in RStudio Workbench, open the Quarto document in the repo, and follow along and complete the exercises.
  • Render, commit, and push your edits by the AE deadline – end of tomorrow.

Recap of AE

  • Data sets should not be labeled as wide or long but they can be made wider or longer for a certain analysis that requires a certain format
  • When pivoting longer, variable names that turn into values are characters by default. If you need them to be in another format, you need to explicitly make that transformation, which you can do so within the pivot_longer() function.
  • You can tweak a plot forever, but at some point the tweaks are likely not very productive. However, you should always be critical of defaults (however pretty they might be) and see if you can improve the plot to better portray your data / results / what you want to communicate.

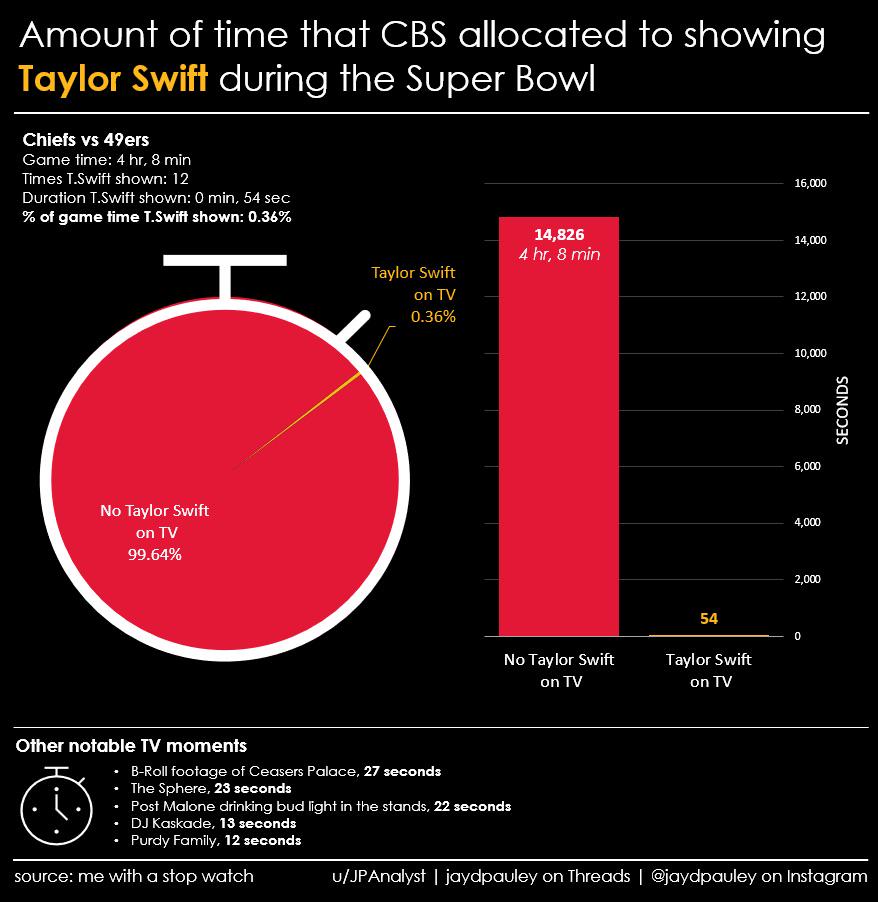
Tortured Visualizations Department