# A tibble: 146 × 3
   film                    critics audience
   <chr>                     <int>    <int>
 1 Avengers: Age of Ultron      74       86
 2 Cinderella                   85       80
 3 Ant-Man                      80       90
 4 Do You Believe?              18       84
 5 Hot Tub Time Machine 2       14       28
 6 The Water Diviner            63       62
 7 Irrational Man               42       53
 8 Top Five                     86       64
 9 Shaun the Sheep Movie        99       82
10 Love & Mercy                 89       87
# ℹ 136 more rowsLinear regression with a single predictor
Lecture 16
Cornell University
INFO 2950 - Spring 2024
March 19, 2024
Announcements

Announcements
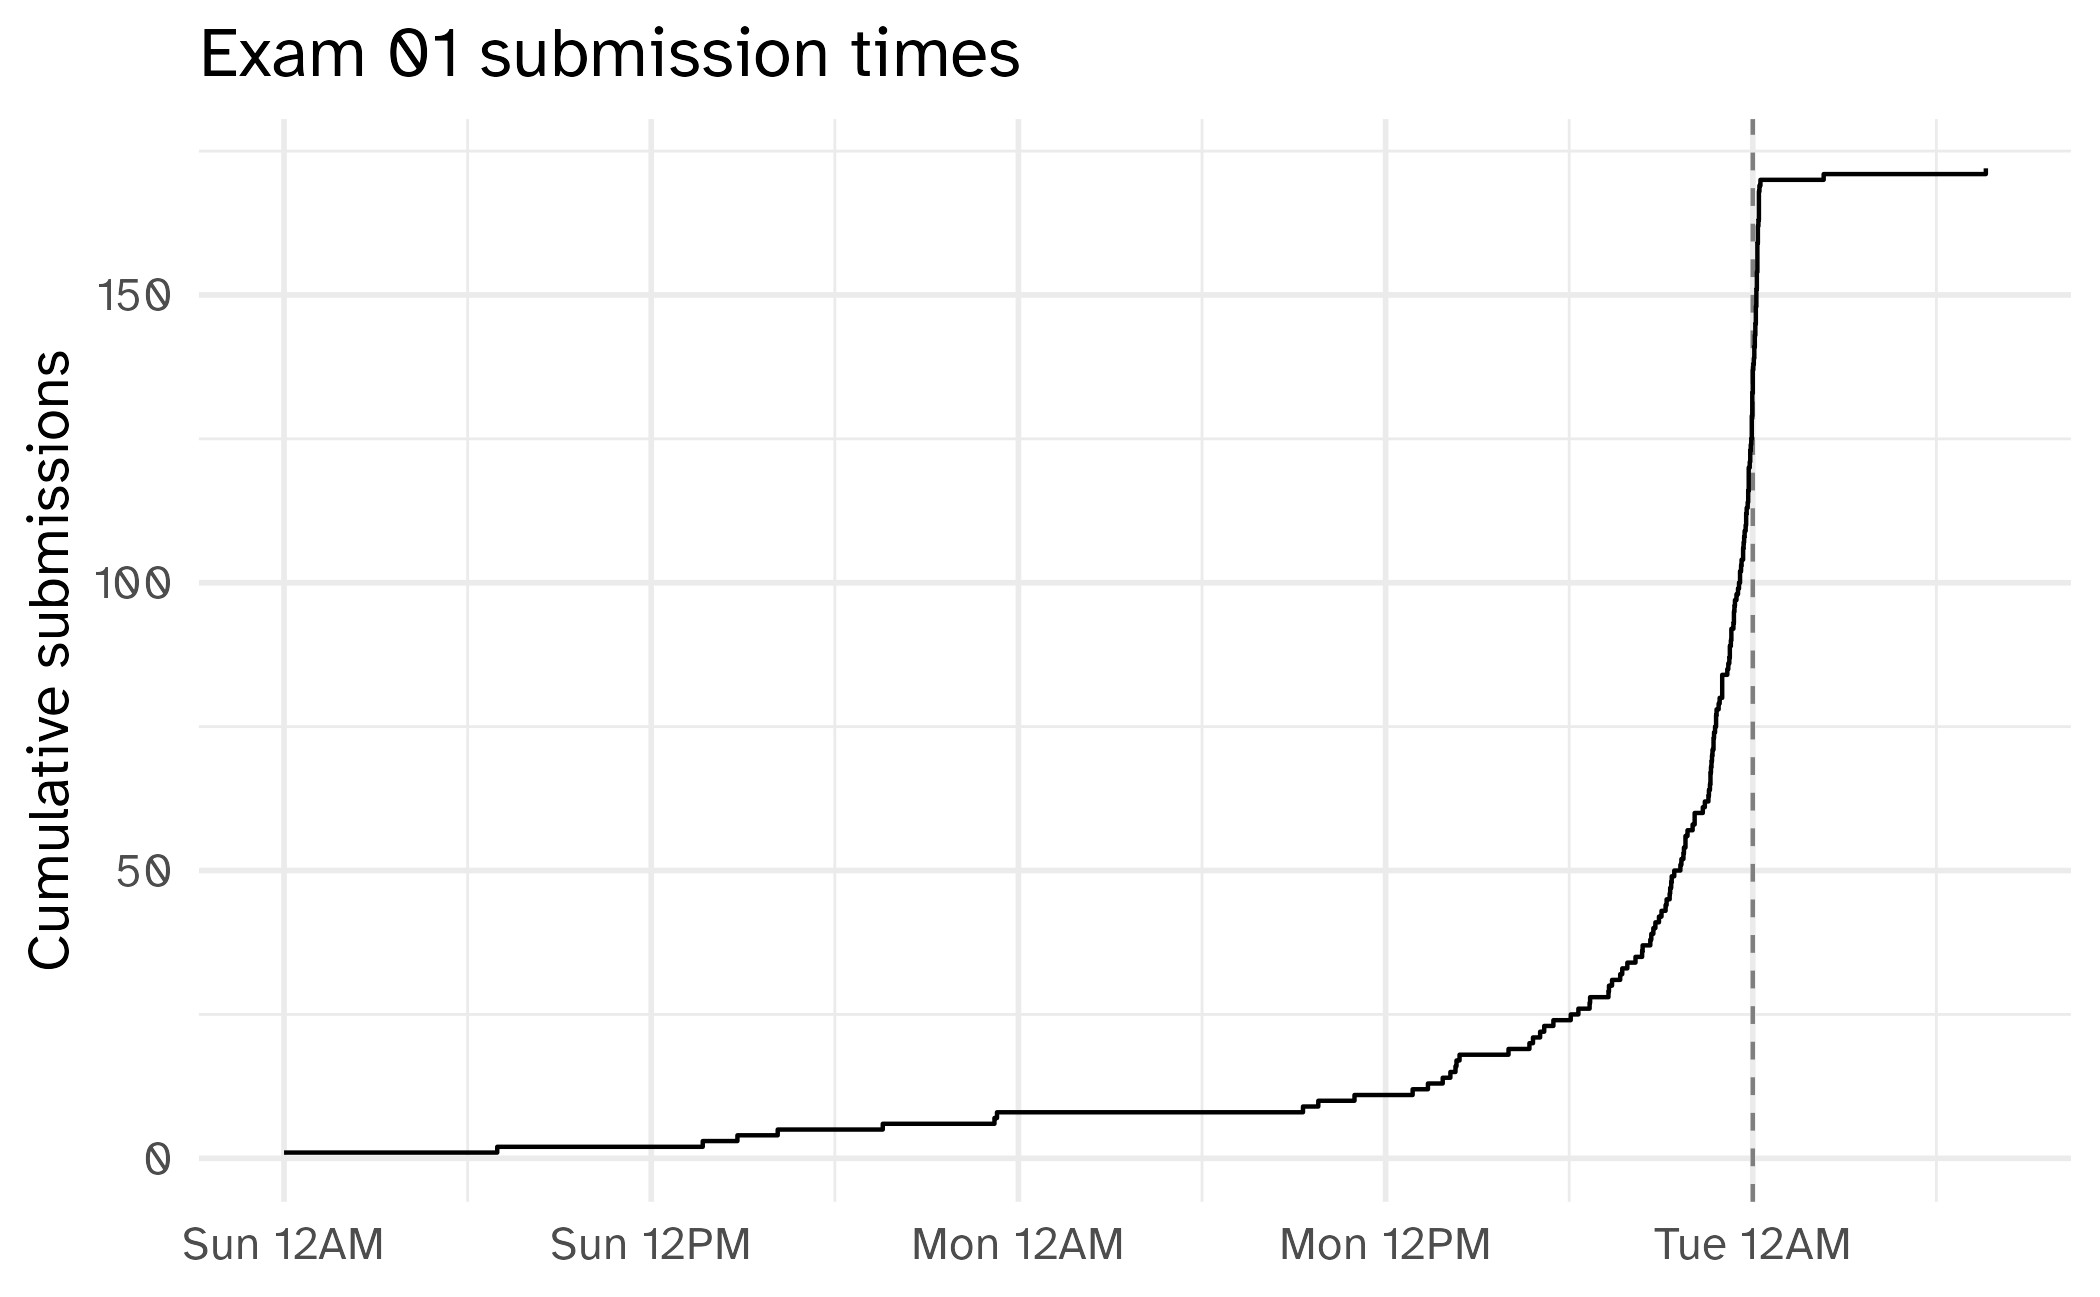
- Exam 01
- Team projects
Goals
- What is a model?
- Why do we model?
- Modeling with a single predictor
- Model parameters, estimates, and error terms
- Interpreting slopes and intercepts
Modelling
Modelling
- Use models to explain the relationship between variables and to make predictions
- Many different types of models
- Linear models – classic forms used for statistical inference
- Nonlinear models – much more common in machine learning for prediction


Modelling vocabulary
- Predictor/feature/explanatory variable/independent variable
- Outcome/dependent variable/response variable
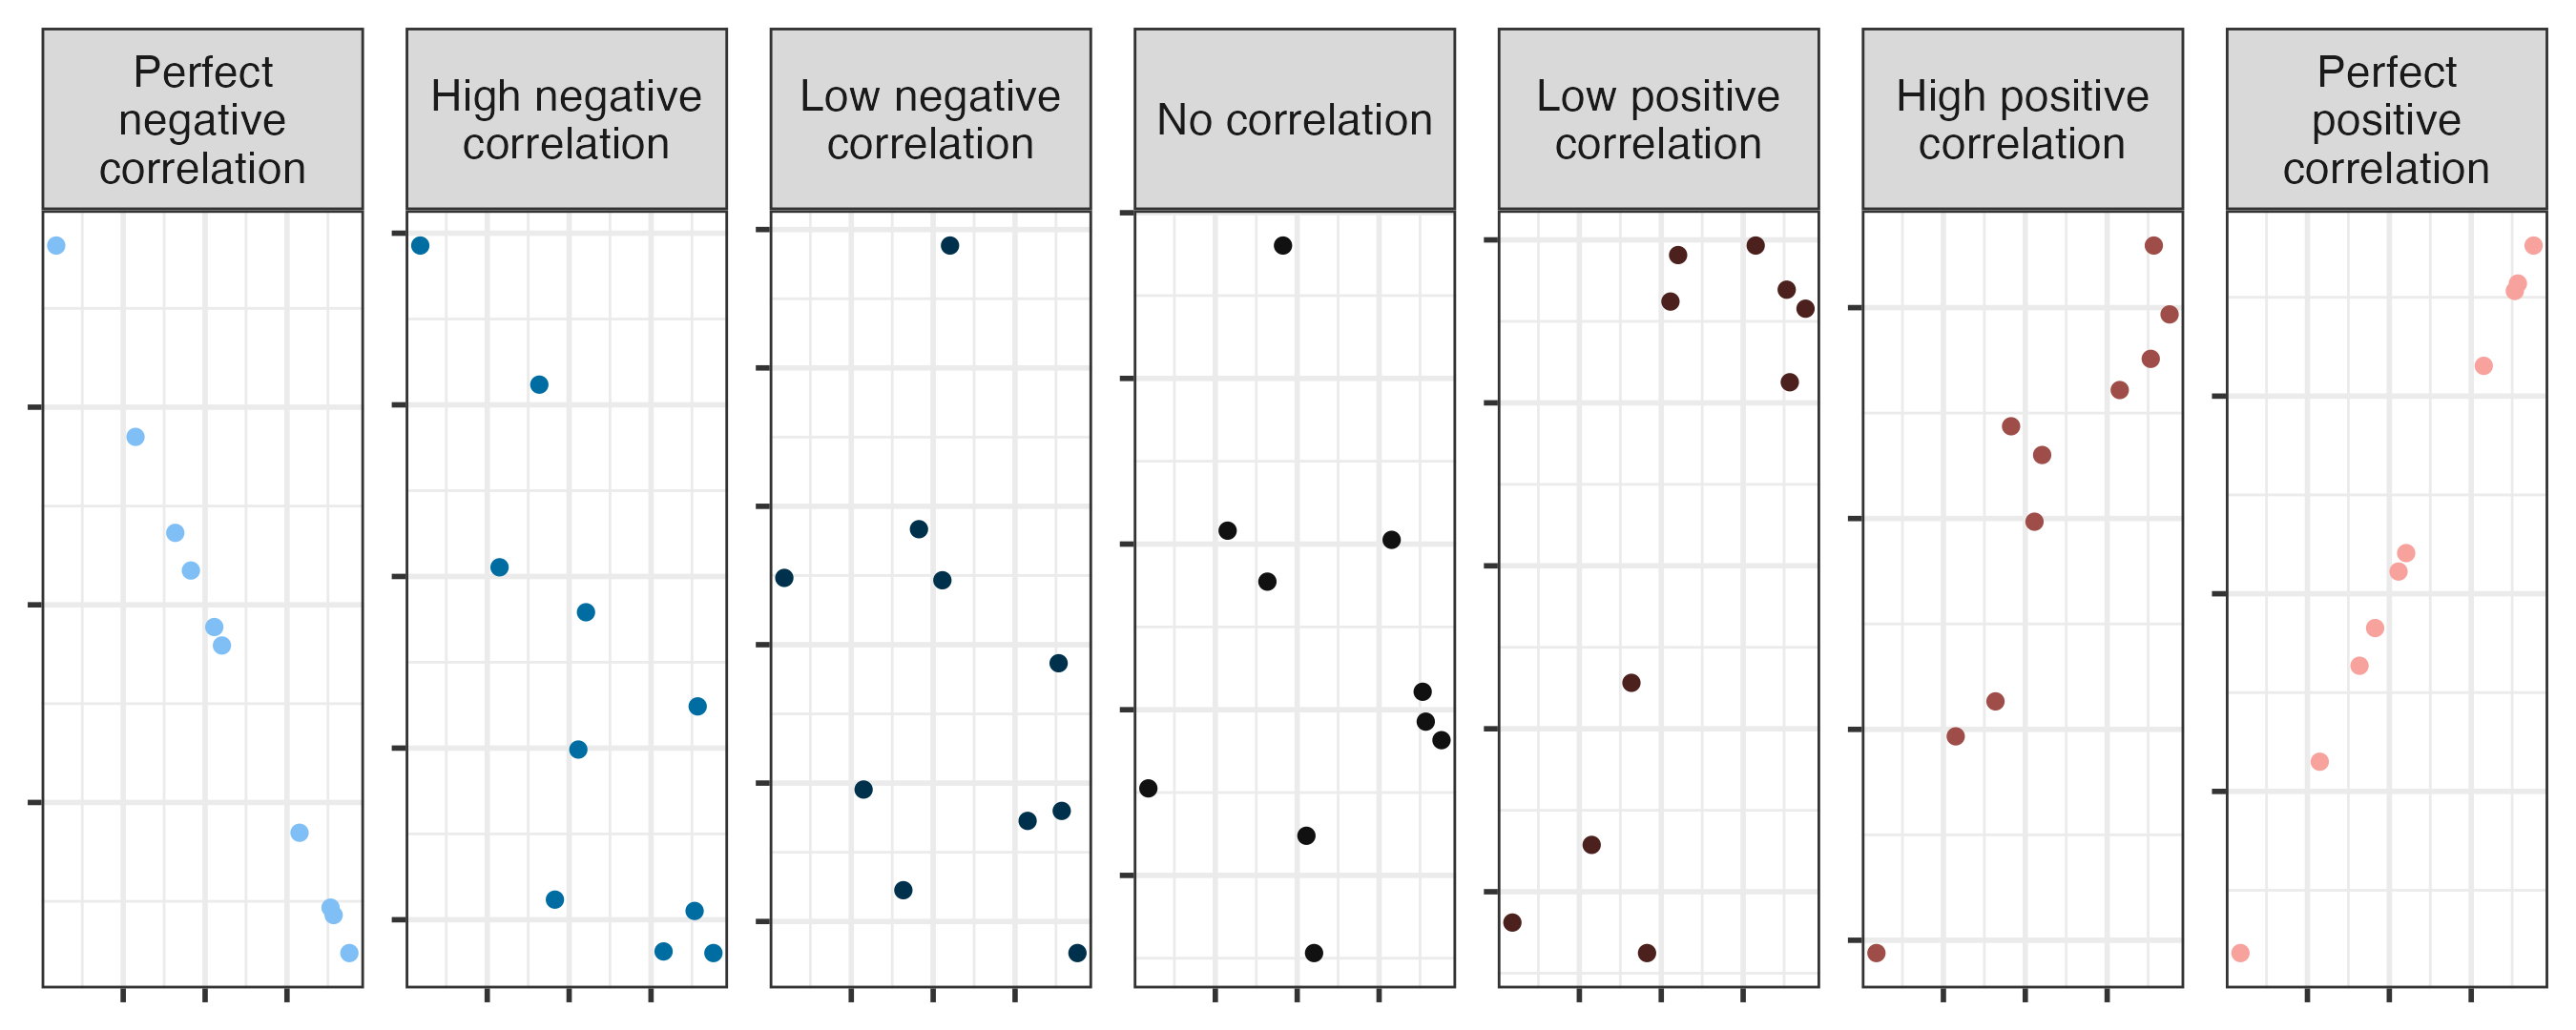
- Correlation
- Regression line (for linear models)
- Slope
- Intercept
Data overview
Modelling film ratings
- What is the relationship between the critics and audience scores for films?
- What is your best guess for a film’s audience score if the critics rated it a 73?

Predictor (explanatory variable)
| audience | critics |
|---|---|
| 86 | 74 |
| 80 | 85 |
| 90 | 80 |
| 84 | 18 |
| 28 | 14 |
| 62 | 63 |
| ... | ... |

Outcome (response variable)
| audience | critics |
|---|---|
| 86 | 74 |
| 80 | 85 |
| 90 | 80 |
| 84 | 18 |
| 28 | 14 |
| 62 | 63 |
| ... | ... |

Regression line

Regression line: slope

Regression line: intercept

Correlation

Correlation
- Ranges between -1 and 1.
- Same sign as the slope.

Models with a single predictor
Regression model
A regression model is a function that describes the relationship between the outcome, \(Y\), and the predictor, \(X\).
\[ \begin{aligned} Y &= \color{black}{\textbf{Model}} + \text{Error} \\ &= \color{black}{\mathbf{f(X)}} + \epsilon \end{aligned} \]
Regression model
\[ \begin{aligned} Y &= \color{#DF1E12}{\textbf{Model}} + \text{Error} \\ &= \color{#DF1E12}{\mathbf{f(X)}} + \epsilon \end{aligned} \]

Simple linear regression
Use simple linear regression to model the relationship between a quantitative outcome (\(Y\)) and a single quantitative predictor (\(X\)):
\[ \begin{aligned} Y &= f(X) \\ &= \beta_0 + \beta_1 X + \epsilon \end{aligned} \]
- \(\beta_1\): True slope of the relationship between \(X\) and \(Y\)
- \(\beta_0\): True intercept of the relationship between \(X\) and \(Y\)
- \(\epsilon\): Error (residual)
But we don’t know \(\beta_0\) and \(\beta_1\) - we only have a sample of 146 movies!
Simple linear regression
\[\Large{\hat{Y} = b_0 + b_1 X}\]
- \(b_1\): Estimated slope of the relationship between \(X\) and \(Y\)
- \(b_0\): Estimated intercept of the relationship between \(X\) and \(Y\)
- No error term!
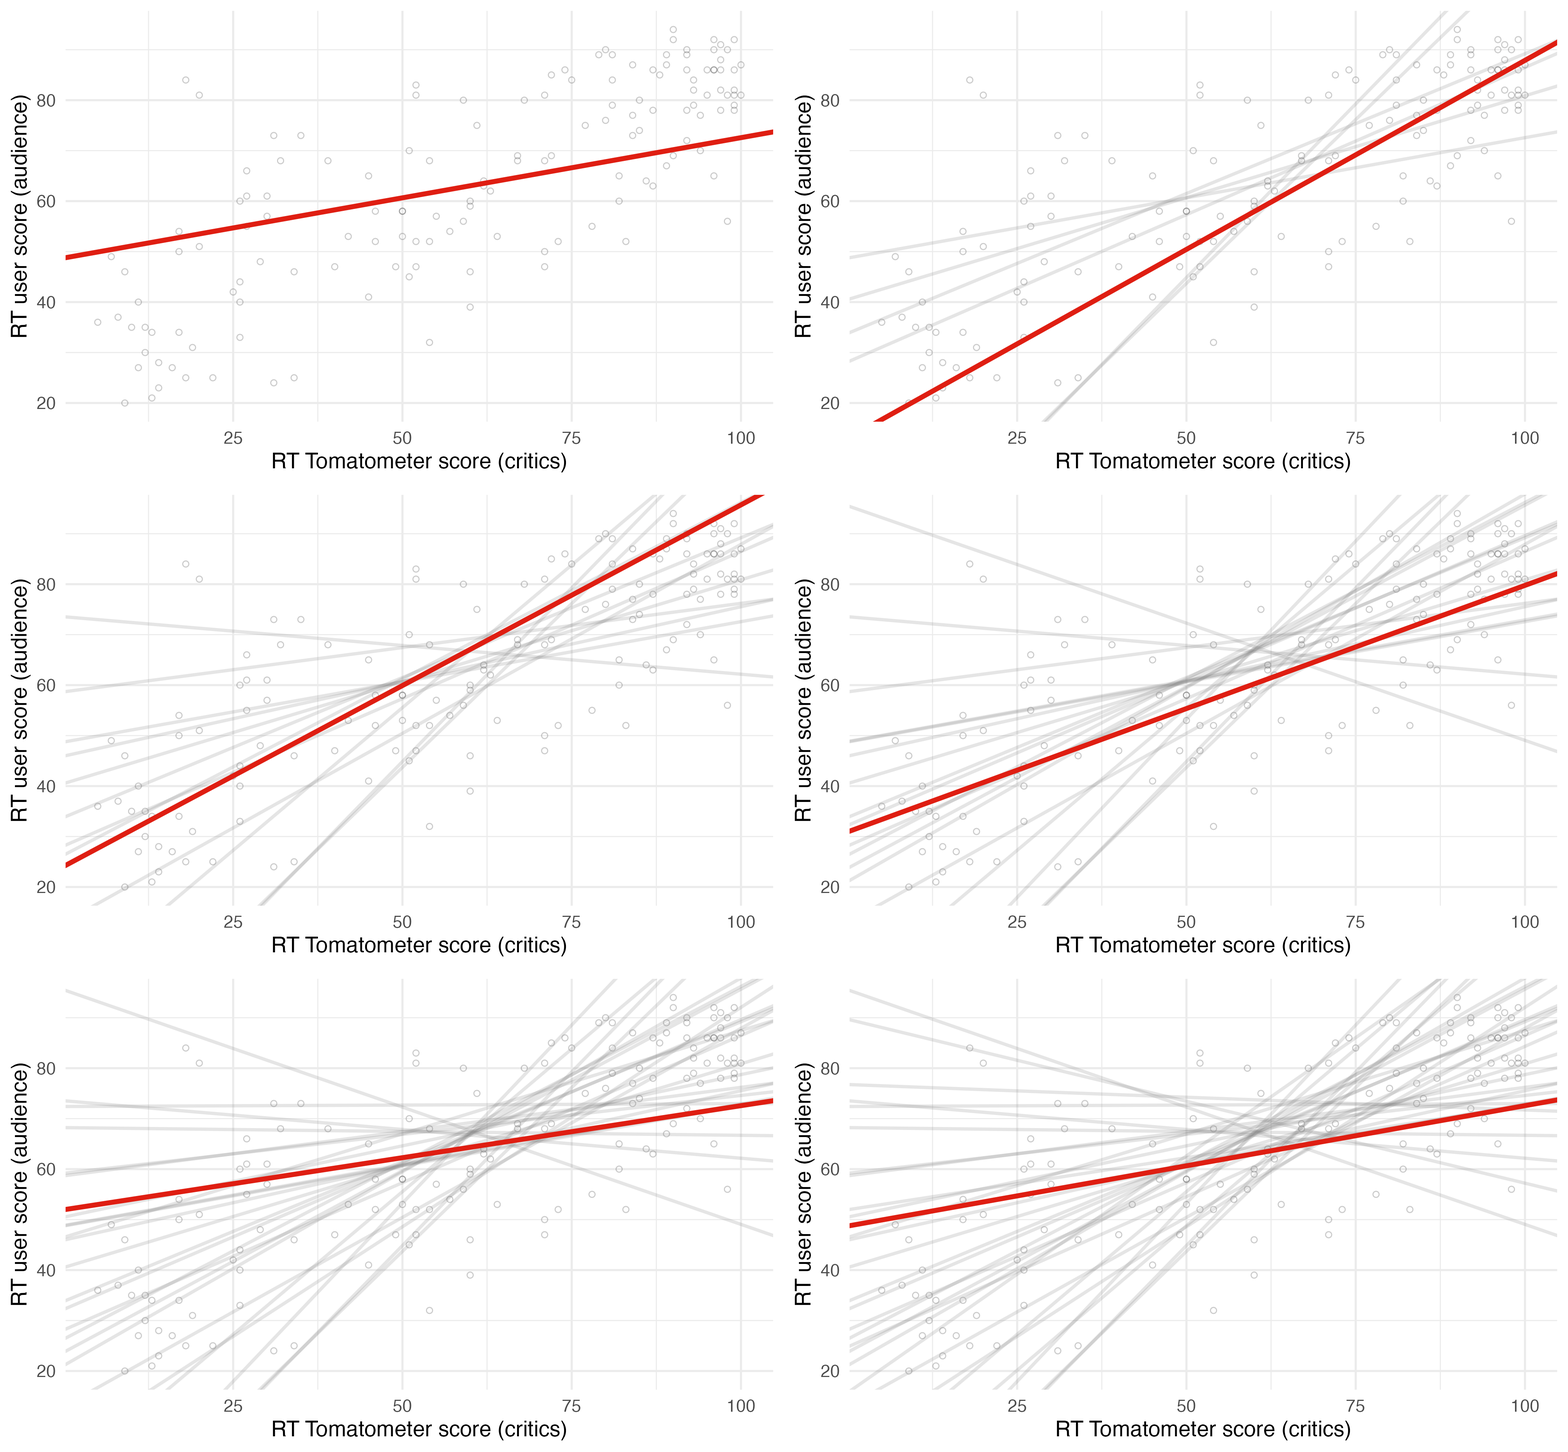
- How do we choose values for \(b_1\) and \(b_0\)?
Choosing values for \(b_1\) and \(b_0\)

Residuals

\[\text{residual} = \text{observed} - \text{predicted} = y - \hat{y}\]
Least squares line
- The residual for the \(i^{th}\) observation is
\[e_i = \text{observed} - \text{predicted} = y_i - \hat{y}_i\]
- The sum of squared residuals is
\[e^2_1 + e^2_2 + \dots + e^2_n\]
- The least squares line is the one that minimizes the sum of squared residuals
Least squares line
Slope and intercept
Properties of least squares regression
The regression line goes through the center of mass point (the coordinates corresponding to average \(X\) and average \(Y\)): \(b_0 = \bar{Y} - b_1~\bar{X}\)
Slope has the same sign as the correlation coefficient: \(b_1 = r \frac{sd_Y}{sd_X}\)
Sum of the residuals is zero: \(\sum_{i = 1}^n \epsilon_i = 0\)
Residuals and \(X\) values are uncorrelated
Interpreting the slope
The slope of the model for predicting audience score from critics score is 0.519. Which of the following is the best interpretation of this value?
- For every one point increase in the critics score, the audience score goes up by 0.519 points, on average.
- For every one point increase in the critics score, we expect the audience score to be higher by 0.519 points, on average.
- For every one point increase in the critics score, the audience score goes up by 0.519 points.
- For every one point increase in the audience score, the critics score goes up by 0.519 points, on average.
Interpreting slope & intercept
\[\widehat{\text{audience}} = 32.3 + 0.519 \times \text{critics}\]
- Slope: For every one point increase in the critics score, we expect the audience score to be higher by 0.519 points, on average.
- Intercept: If the critics score is 0 points, we expect the audience score to be 32.3 points.
Is the intercept meaningful?
✅ The intercept is meaningful in context of the data if
- the predictor can feasibly take values equal to or near zero or
- the predictor has values near zero in the observed data
🛑 Otherwise, it might not be meaningful!
Application exercise

ae-14
- Go to the course GitHub org and find your
ae-14(repo name will be suffixed with your GitHub name). - Clone the repo in RStudio Workbench, open the Quarto document in the repo, and follow along and complete the exercises.
- Save, commit, and push your edits by the AE deadline – end of the day tomorrow.
Recap of AE
- Linear regression fits a line to the relationship between \(X\) and \(Y\)
- It estimates coefficients that minimize the sum of squared error (residuals)
- Categorical independent variables are split into a set of coefficients (one for each category minus a held-out column)
Acknowledgments
- Draws upon material from Data Science in a Box licensed under Creative Commons Attribution-ShareAlike 4.0 International
Penguins
