02:00
Unsupervised learning: Dimension reduction
Lecture 25
Dr. Benjamin Soltoff
Cornell University
INFO 2950 - Spring 2024
April 25, 2024
Announcements
Announcements
- Peer review in lab
- Homework 07
What is unsupervised learning?
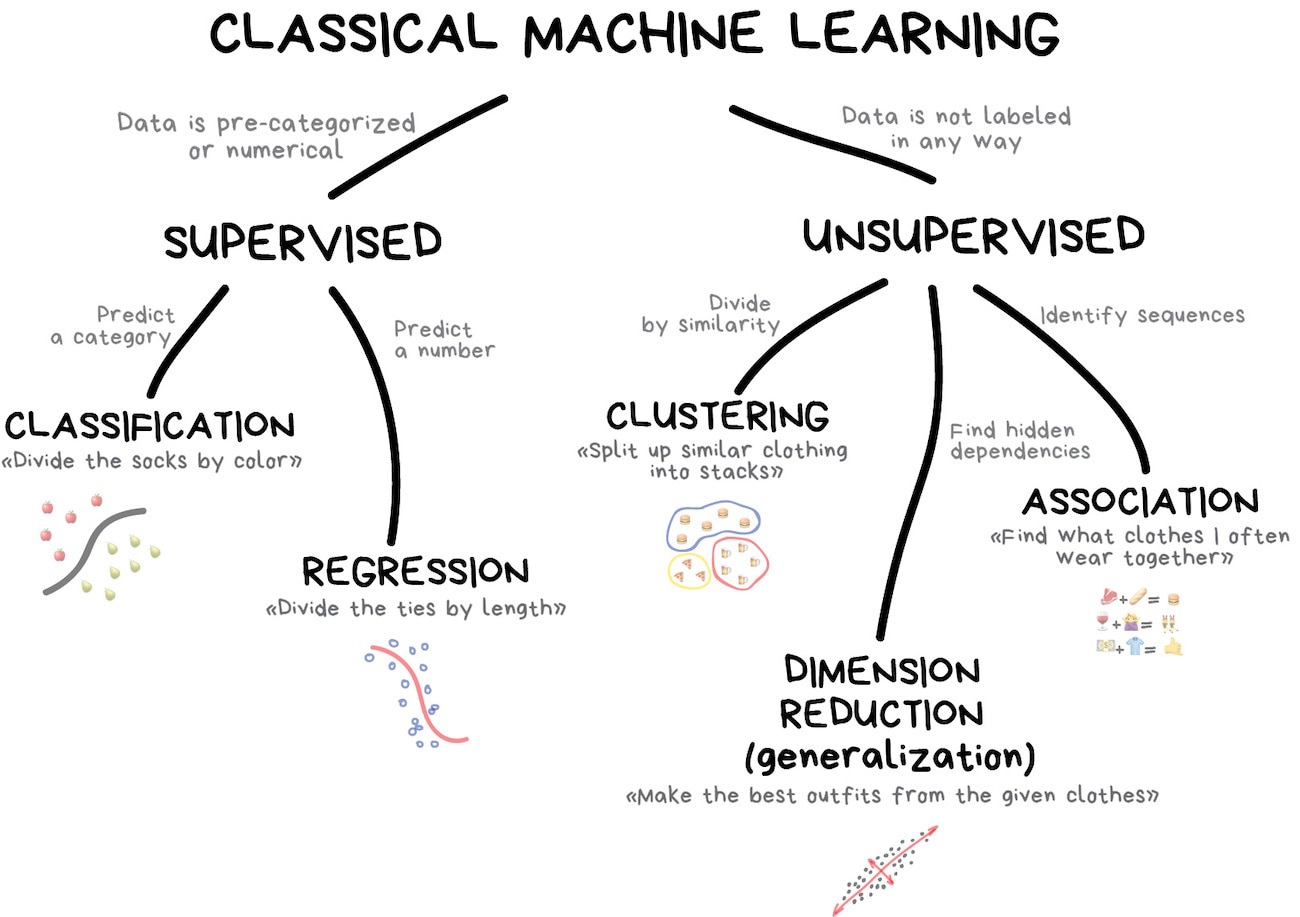
Dimension reduction
Dimension reduction
- Transformation of data from a high-dimensional space into a low-dimensional space
- Low-dimensional representation retains meaningful properties of the original data
Motivations for dimension reduction
- Exploratory analysis and visualization
- Resolving multicollinearity in regression features
- Dealing with sparse data (curse of dimensionality)
Dimension reduction methods
Linear methods
- Principal components analysis (PCA)
- Singular value decomposition (SVD)
- Linear discriminant analysis (LDA)
Nonlinear methods
- Latent semantic analysis (LSA)
- Latent Direchlet allocation (LDA)
- T-distributed stochastic neighbor embedding (t-SNE)
- Uniform manifold approximation and projection (UMAP)
Applications
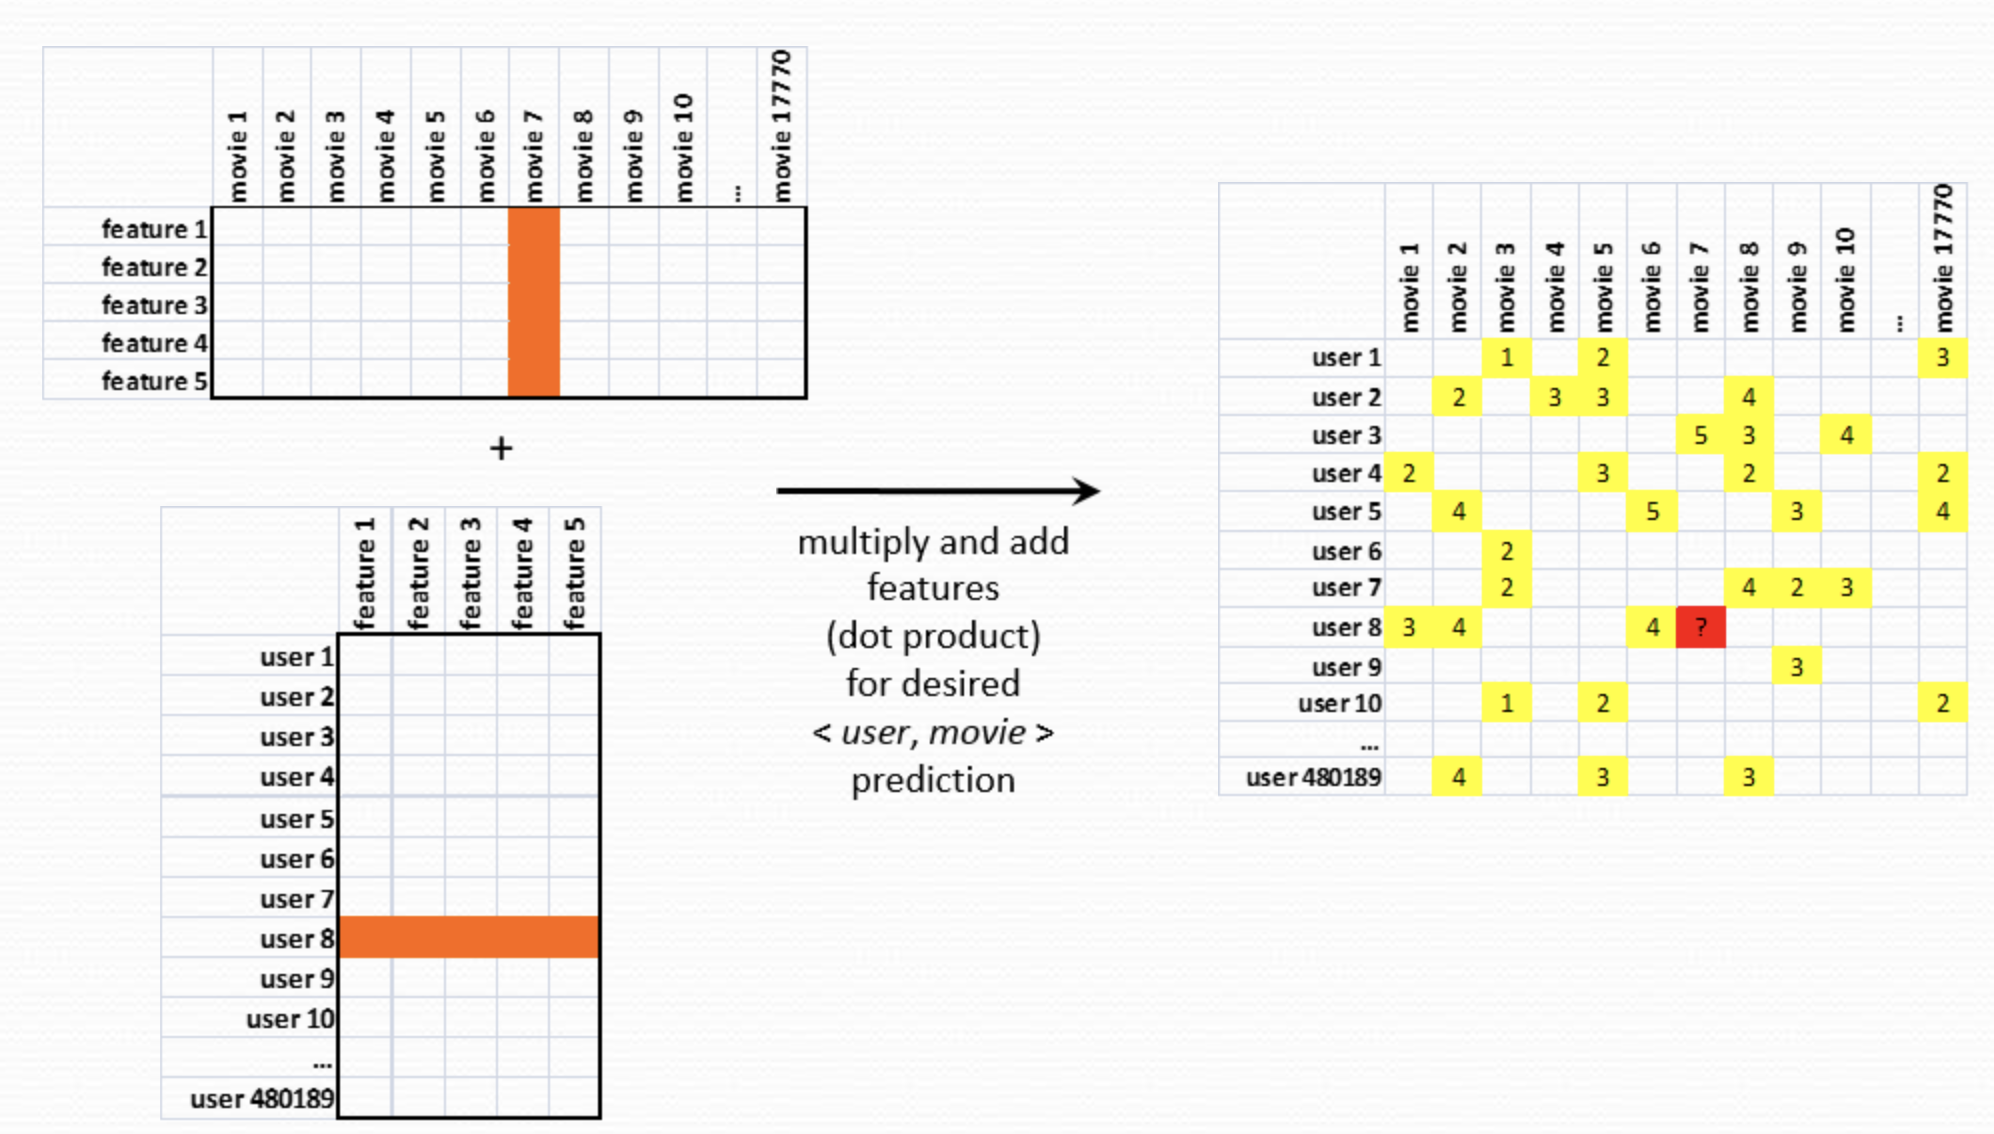
Netflix prize
- Objective: Build a collaborative filtering algorithm to predict user ratings for films based on previous ratings.
- Performance metric: Improve on the existing model by 10% (based on test set RMSE)
- Data: 100,480,507 ratings from 480,189 users on 17,770 movies
- Prize: $1,000,000
Winning approach
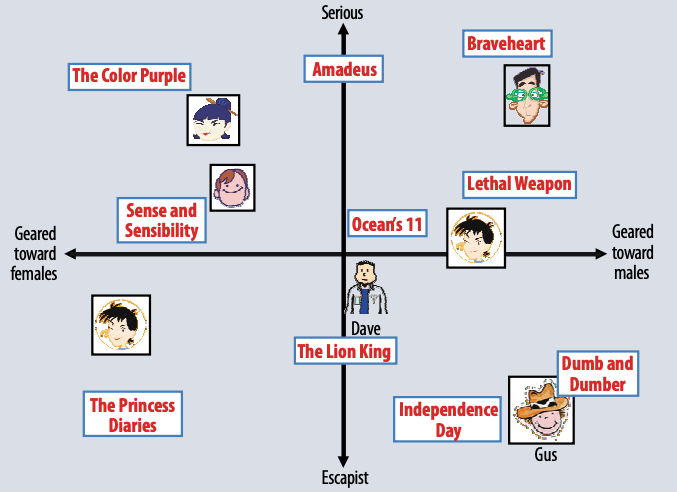
Singular value decomposition
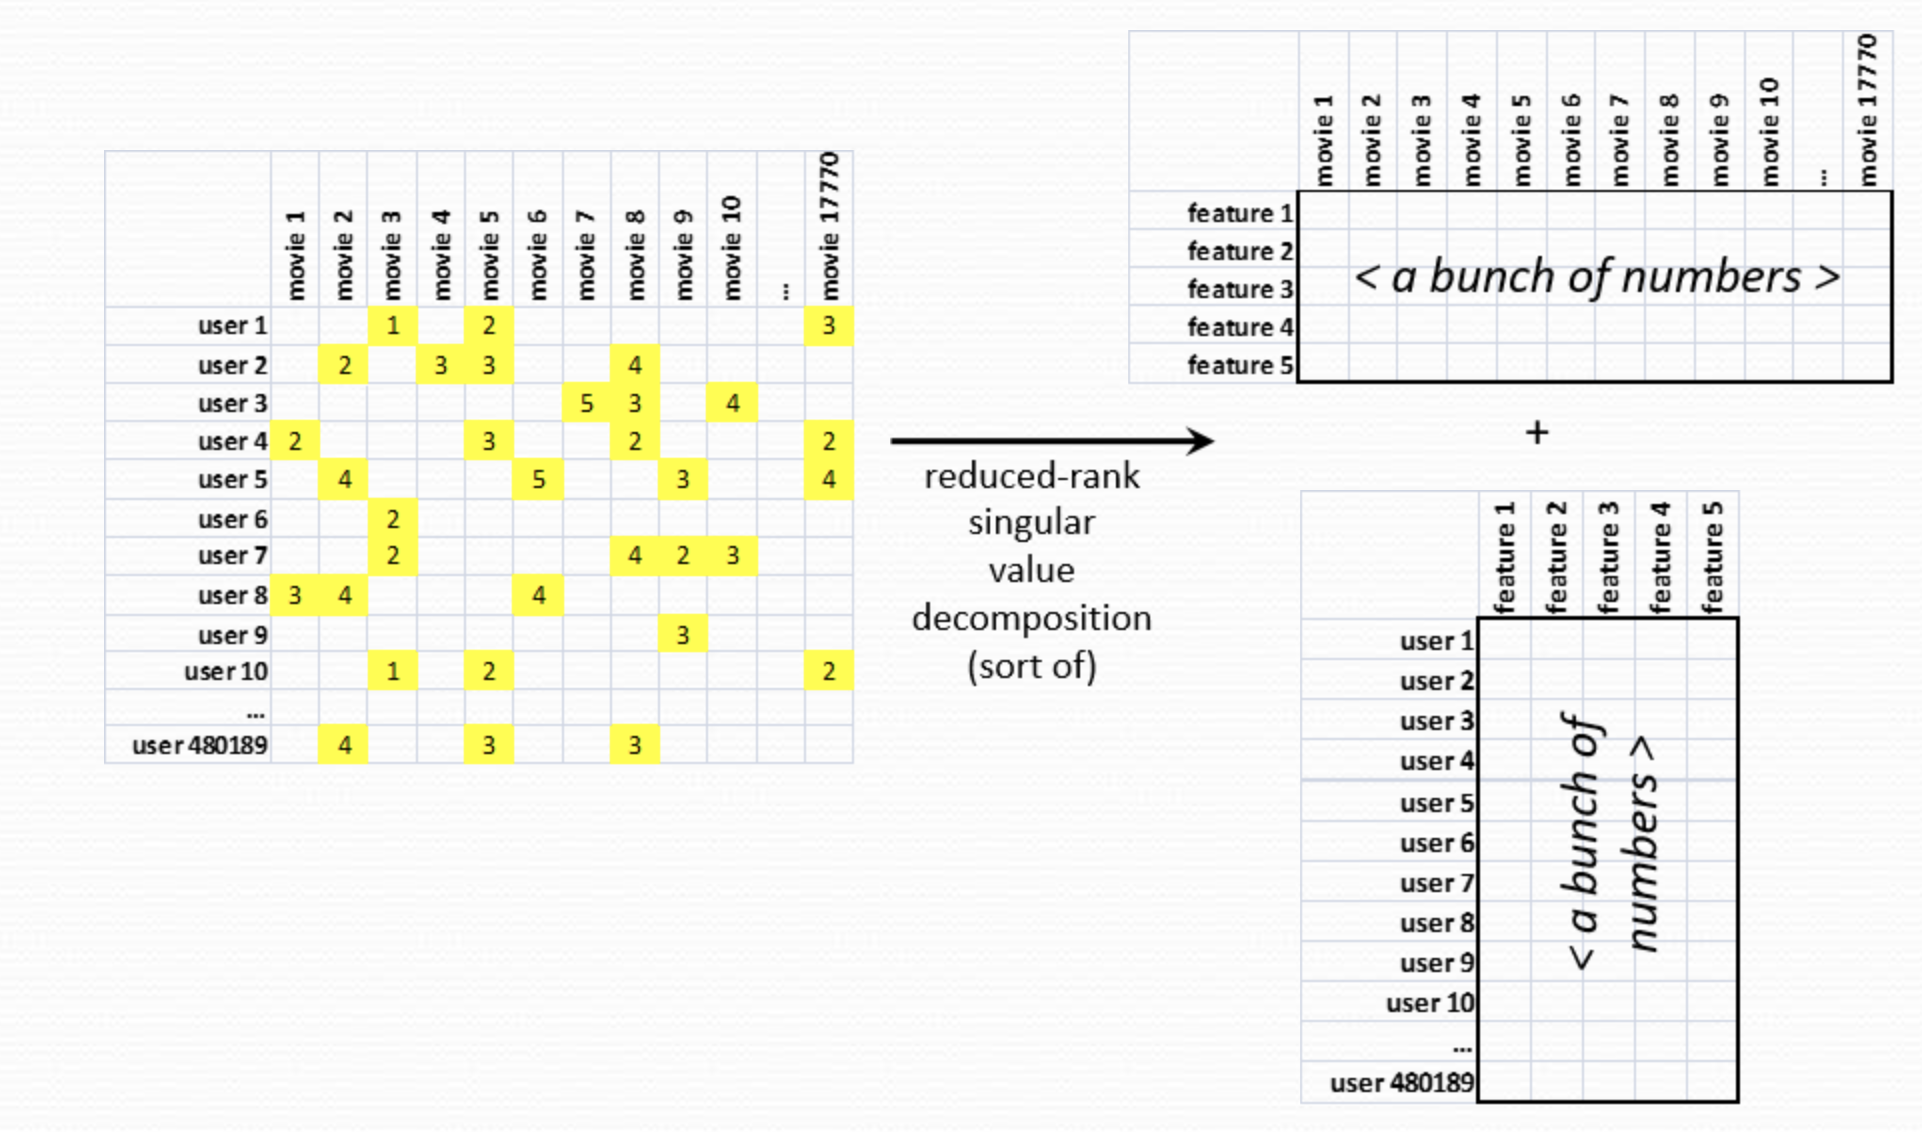
Singular value decomposition
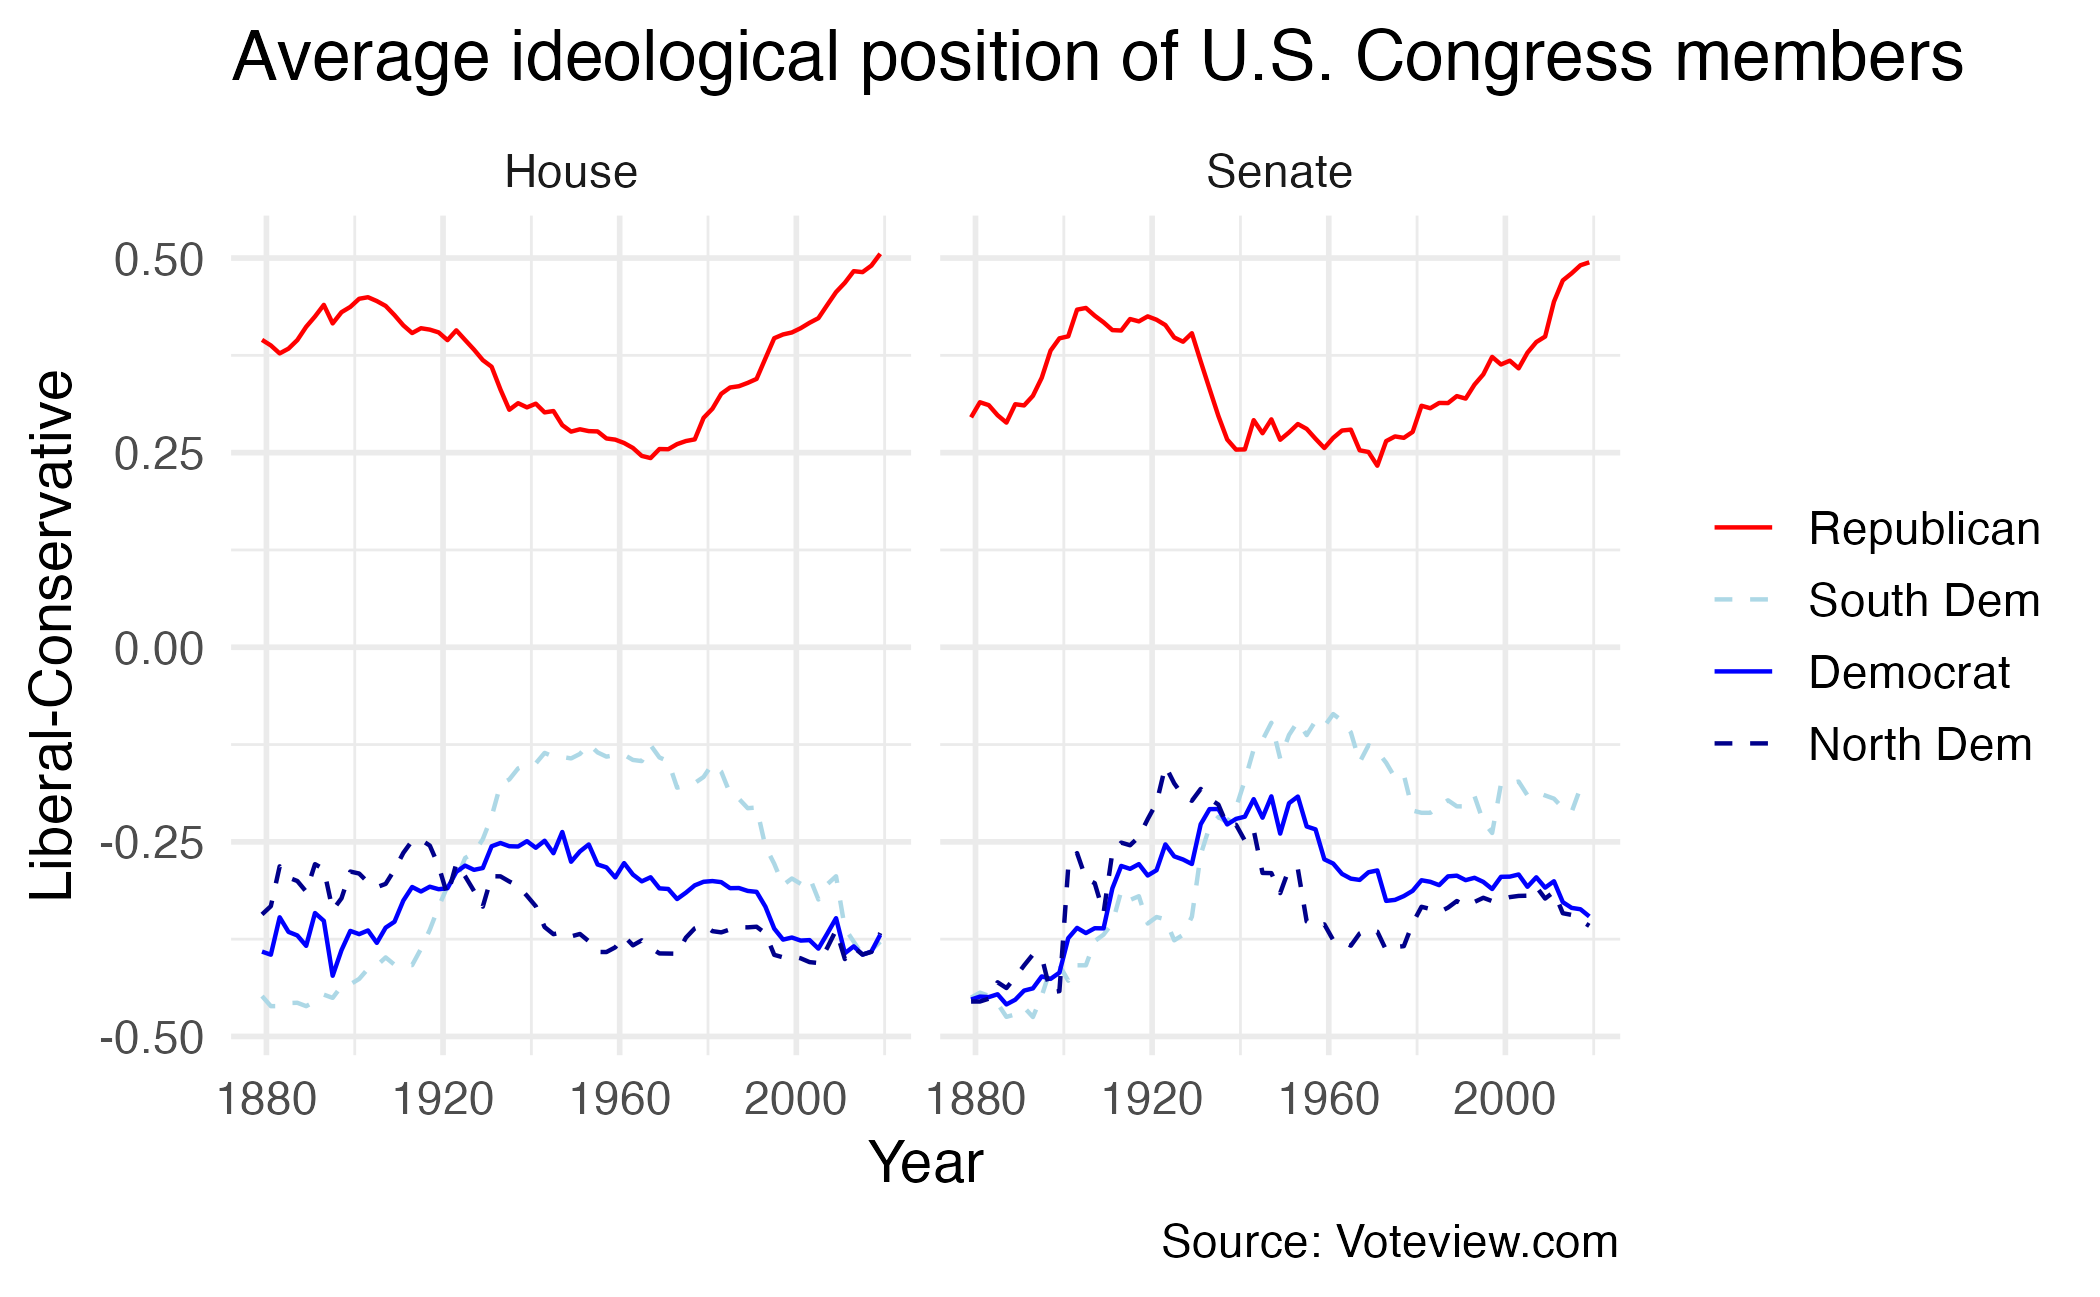
Measuring legislator ideology
What is political ideology? How do you measure it for a legislator?
Defining ideology on a liberal-conservative spectrum
- How do you locate legislators on this spectrum?
- How liberal/conservative are members of the same political party?
- How do you compare them over time (e.g. how liberal a Democrat was in 1870 vs. 1995)?
DW-NOMINATE
- Use roll-call votes to measure ideology
- Over 100,000 recorded votes over time in the U.S. Congress
- Dimension reduction to reduce the number of meaningful dimensions of variation across legislators over time
- Results in two dimensions:
- Political ideology
- “Issue of the day” (e.g. slavery, civil rights, economic policy)
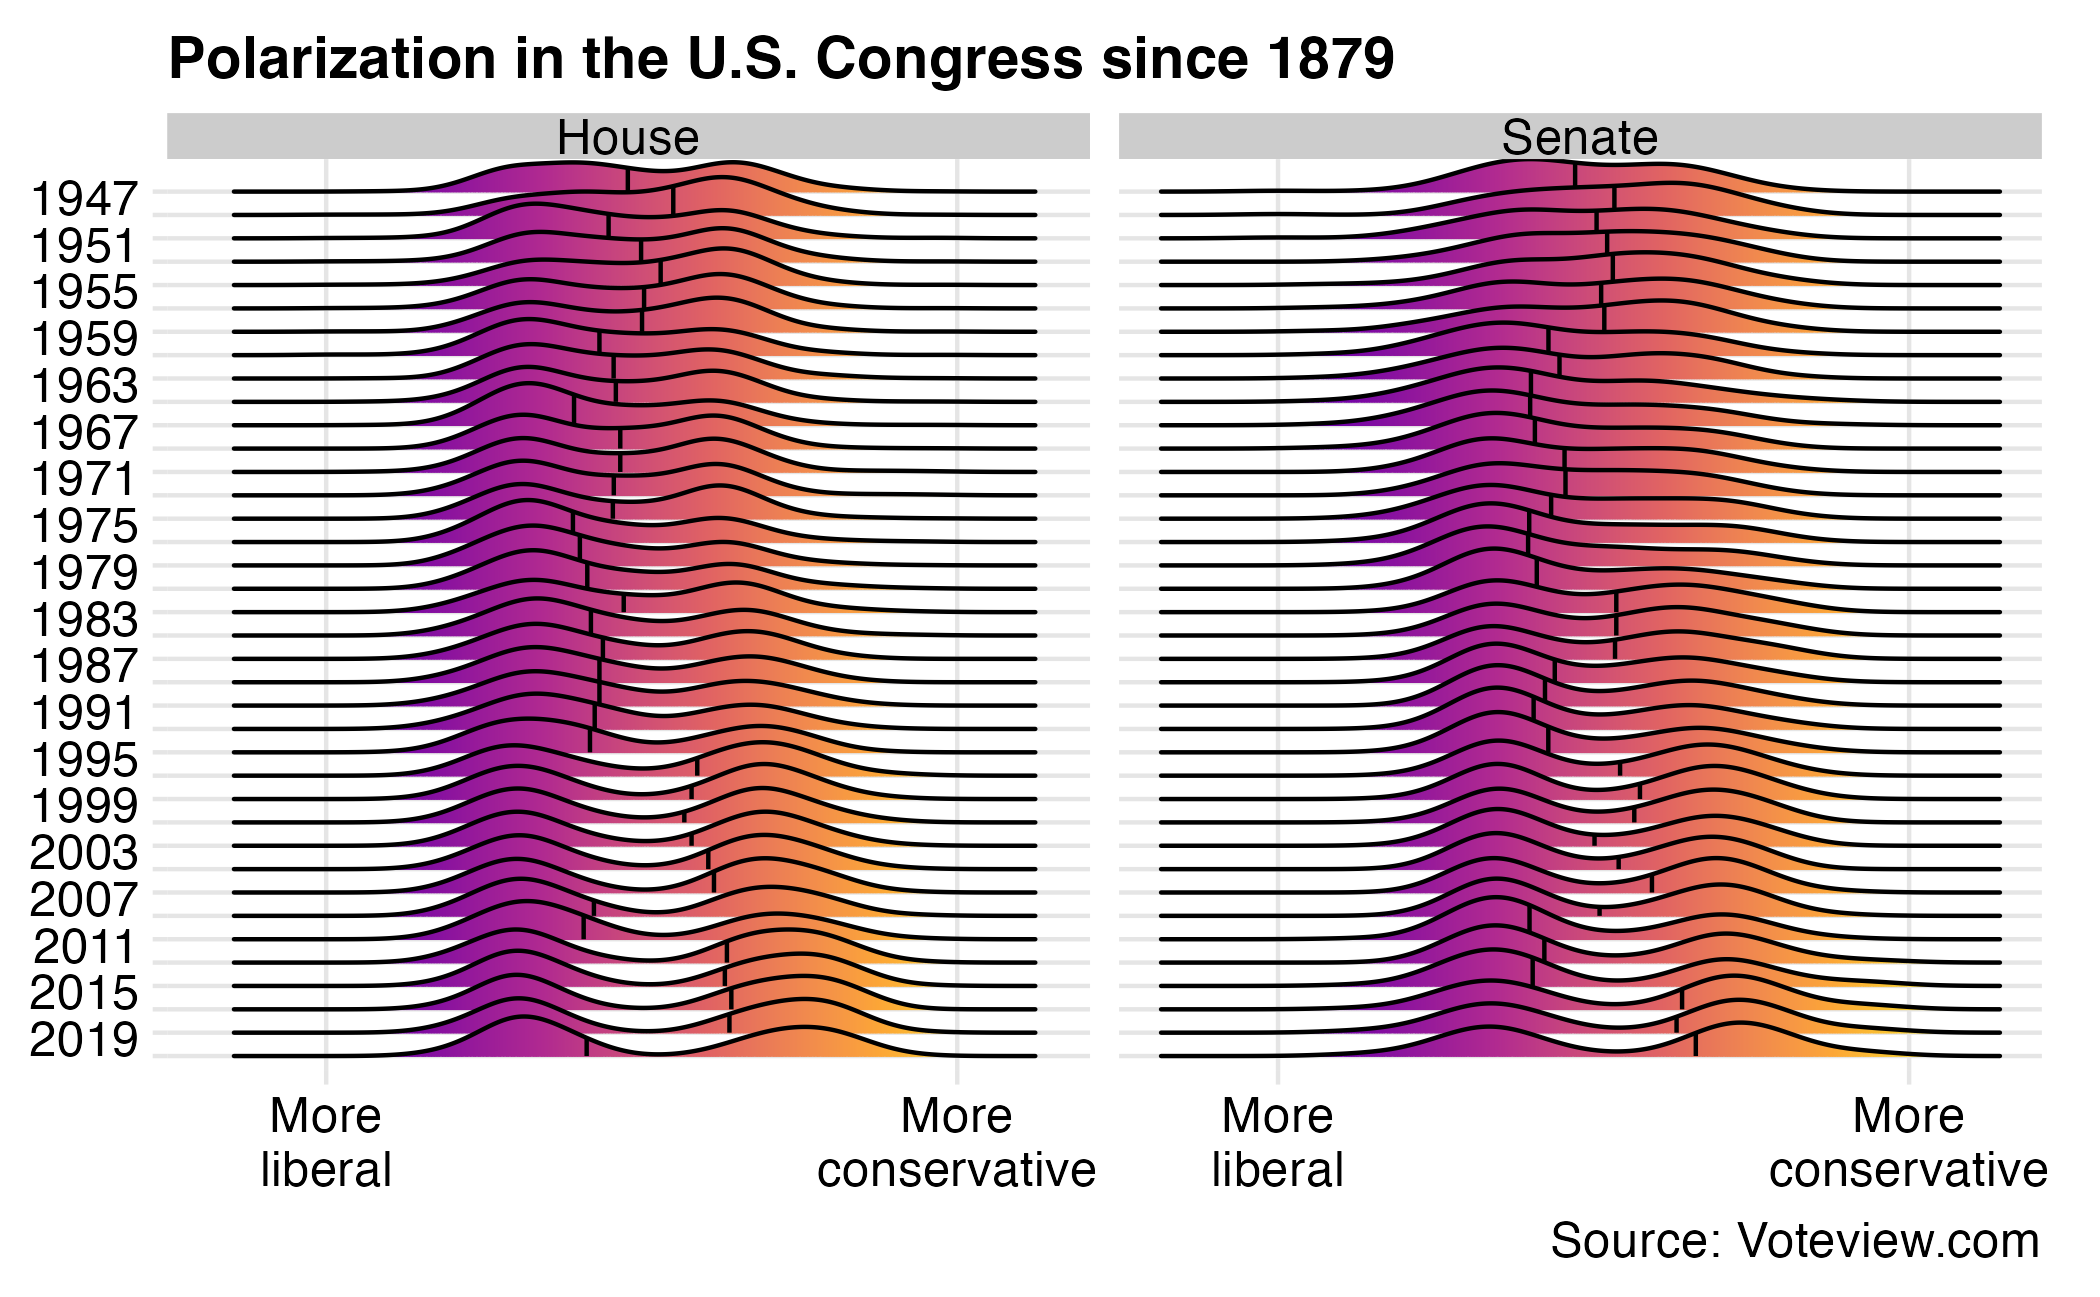
Polarization over time
Polarization over time
Principal components analysis
Principal components analysis
- Reduce the dimensionality of the data set through linear combinations of features \(X_1, X_2, \ldots, X_p\)
- Common purposes
- Feature reduction
- Reduce multicollinearity
- Data visualization
Principal components
- Explain most of the variability in the data with a smaller number of variables
- Low-dimensional representation of high-dimensional data, with minimal information loss
- Small number of dimensions
- Amount that the observations vary along each dimension
- Linear combination of \(p\) features
- Requires standardized features
First principal component
Data set \(X_1, X_2, \ldots, X_p\)
\[Z_1 = \phi_{11}X_1 + \phi_{21}X_2 + \dots + \phi_{p1}X_p\]
\(\max \mathrm{Var}(Z_1)\)
\(\phi_1\) - first principal component loading vector
- \(p\) individual loadings \(\phi_{11}, \dots, \phi_{p1}\)
Normalized \(\phi\)
\[\sum_{j=1}^p \phi_{j1}^2 = 1\]
Second principal component
\[Z_2 = \phi_{12}X_1 + \phi_{22}X_2 + \dots + \phi_{p2}X_p\]
\[\max \mathrm{Var}(Z_2)\]
- \(\sum_{j=1}^p \phi_{j2}^2 = 1\)
- \(Z_1, Z_2\) uncorrelated (orthogonal)
\(n\)th principal component
- \(\min(p, n)\) unique principal components
- As \(j\) increases, variance of \(Z_j\) constantly decreasing
Fashion MNIST dataset
Fashion MNIST dataset
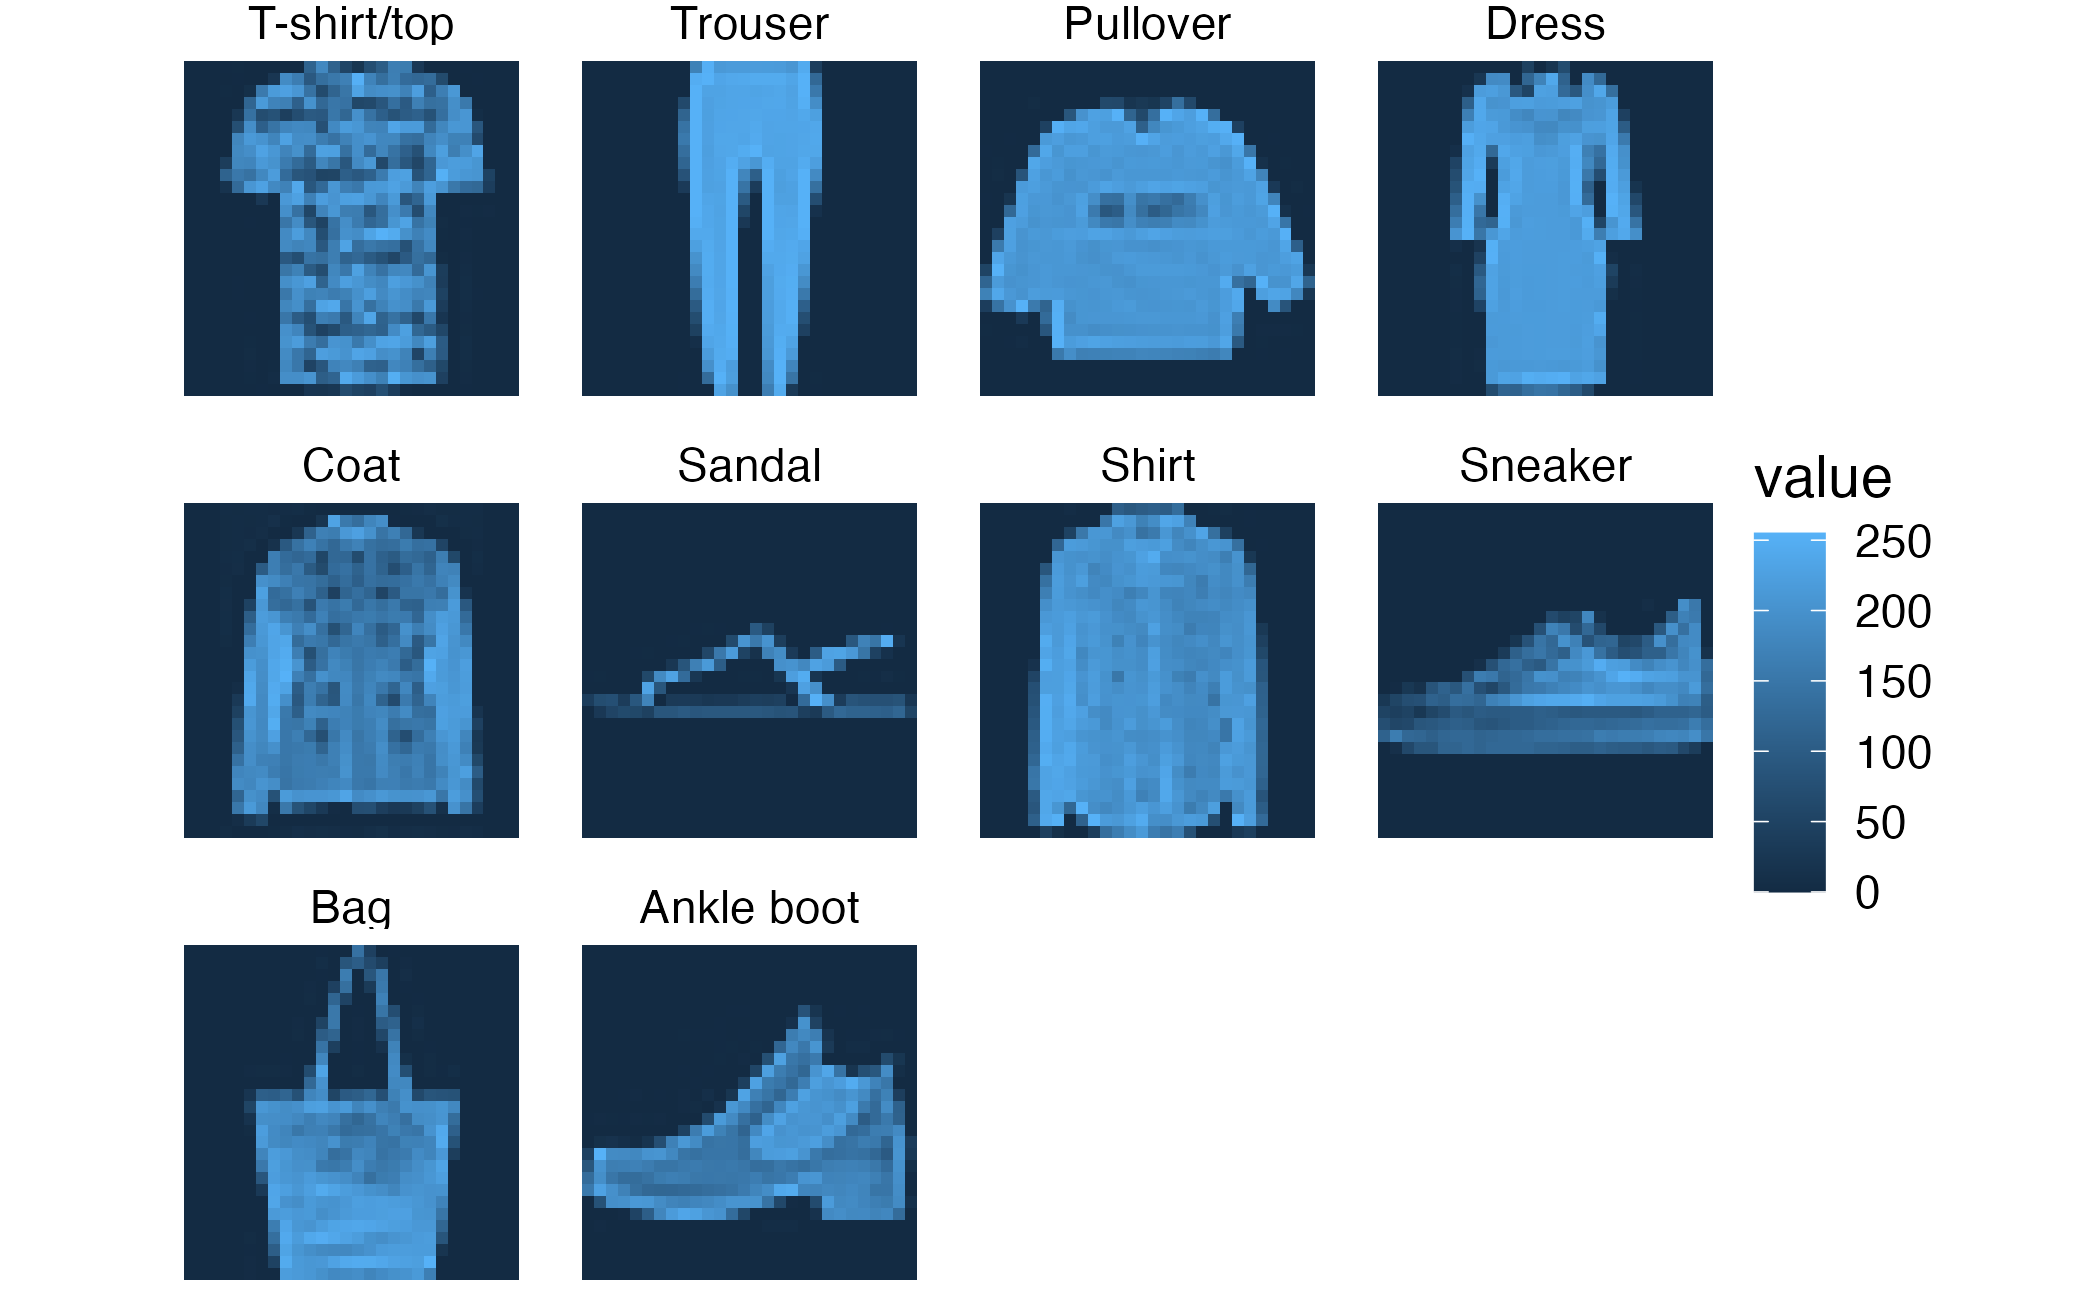
Fashion MNIST dataset
# A tibble: 60,000 × 785
label pixel1 pixel2 pixel3 pixel4 pixel5 pixel6 pixel7 pixel8 pixel9 pixel10
<fct> <dbl> <dbl> <dbl> <dbl> <dbl> <dbl> <dbl> <dbl> <dbl> <dbl>
1 Pullo… 0 0 0 0 0 0 0 0 0 0
2 Ankle… 0 0 0 0 0 0 0 0 0 0
3 Shirt 0 0 0 0 0 0 0 5 0 0
4 T-shi… 0 0 0 1 2 0 0 0 0 0
5 Dress 0 0 0 0 0 0 0 0 0 0
6 Coat 0 0 0 5 4 5 5 3 5 6
7 Coat 0 0 0 0 0 0 0 0 0 0
8 Sandal 0 0 0 0 0 0 0 0 0 0
9 Coat 0 0 0 0 0 0 3 2 0 0
10 Bag 0 0 0 0 0 0 0 0 0 0
# ℹ 59,990 more rows
# ℹ 774 more variables: pixel11 <dbl>, pixel12 <dbl>, pixel13 <dbl>,
# pixel14 <dbl>, pixel15 <dbl>, pixel16 <dbl>, pixel17 <dbl>, pixel18 <dbl>,
# pixel19 <dbl>, pixel20 <dbl>, pixel21 <dbl>, pixel22 <dbl>, pixel23 <dbl>,
# pixel24 <dbl>, pixel25 <dbl>, pixel26 <dbl>, pixel27 <dbl>, pixel28 <dbl>,
# pixel29 <dbl>, pixel30 <dbl>, pixel31 <dbl>, pixel32 <dbl>, pixel33 <dbl>,
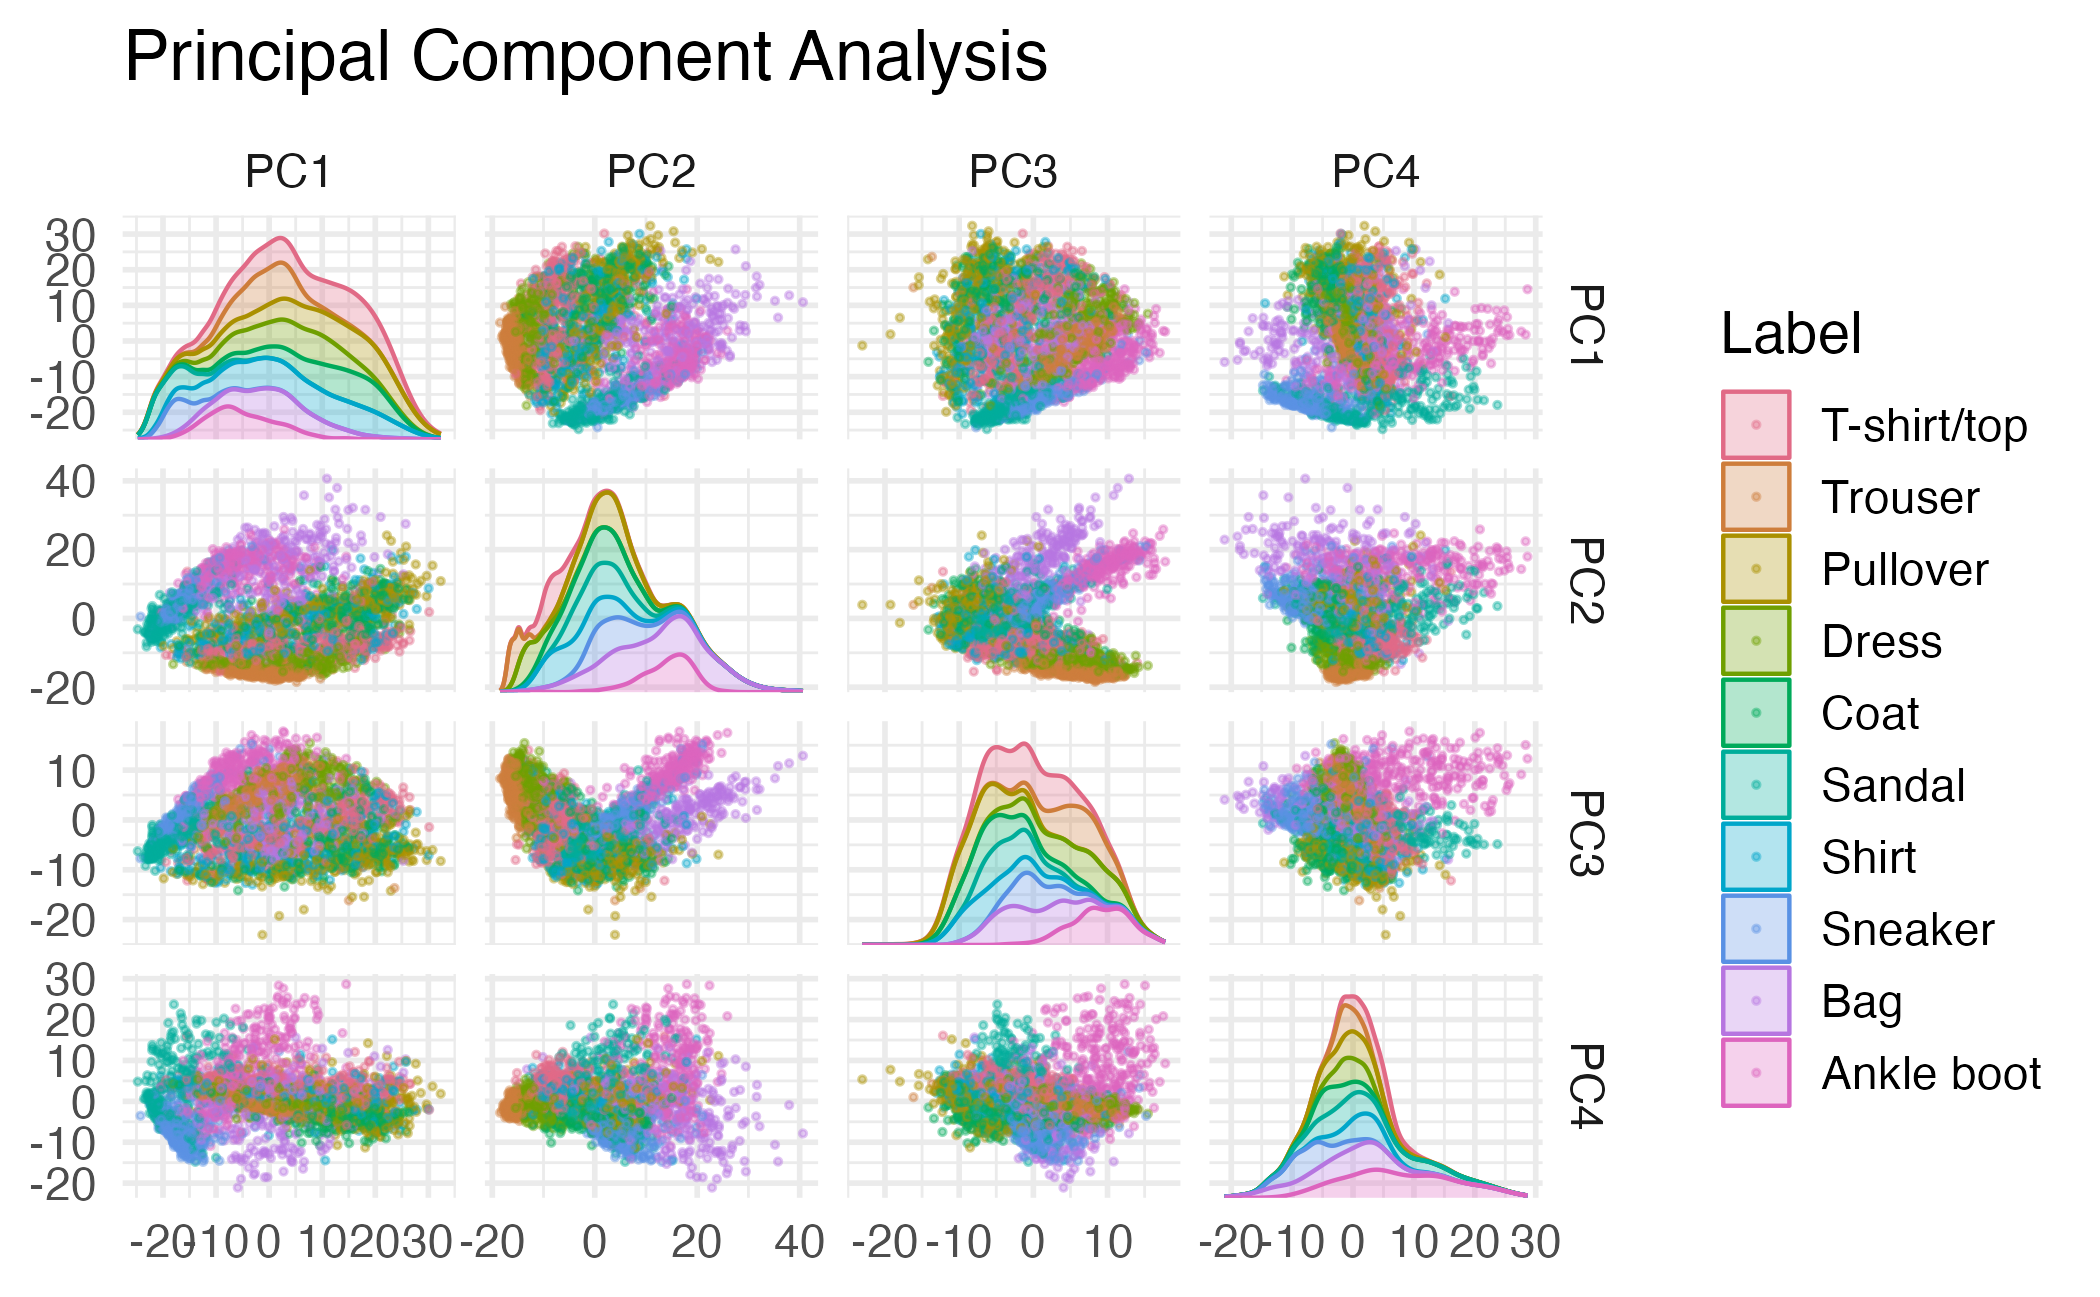
# pixel34 <dbl>, pixel35 <dbl>, pixel36 <dbl>, pixel37 <dbl>, …PCA on pixel features
Selecting the number of PCs
- Total variance in a dataset
\[\sum_{j=1}^p \mathrm{Var}(X_j) = \sum_{j=1}^p \frac{1}{N} \sum_{i=1}^N x_{ij}^2\]
- Variance explained by the \(m\)th principal component
\[\frac{1}{N} \sum_{i=1}^N z_{im}^2 = \frac{1}{N} \sum_{i=1}^N \left( \sum_{j=1}^p \phi_{jm} x_{ij} \right)^2\]
- Proportion of variance explained by the \(m\)th principal component
\[\text{PVE} = \frac{\sum_{i=1}^N \left( \sum_{j=1}^p \phi_{jm} x_{ij} \right)^2}{\sum_{j=1}^p \sum_{i=1}^N x_{ij}^2}\]
\[\text{PVE} = \frac{\lambda_m}{\sum_{j=1}^p \lambda_j}\]
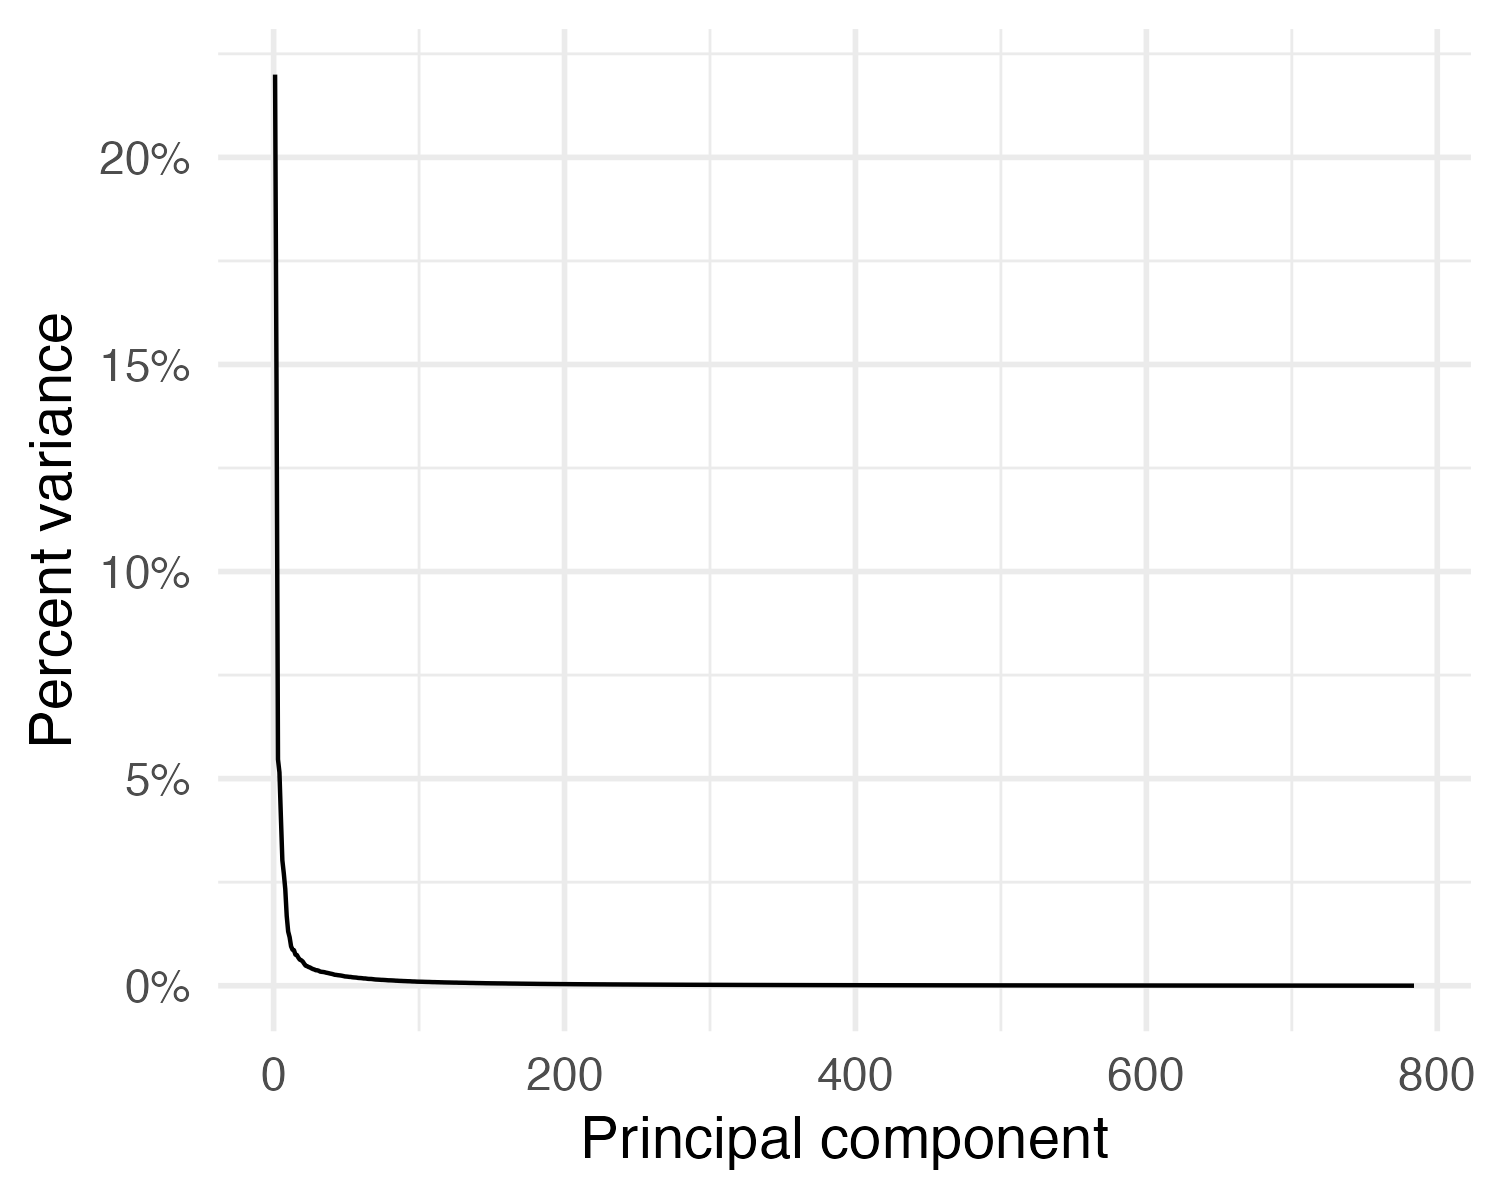
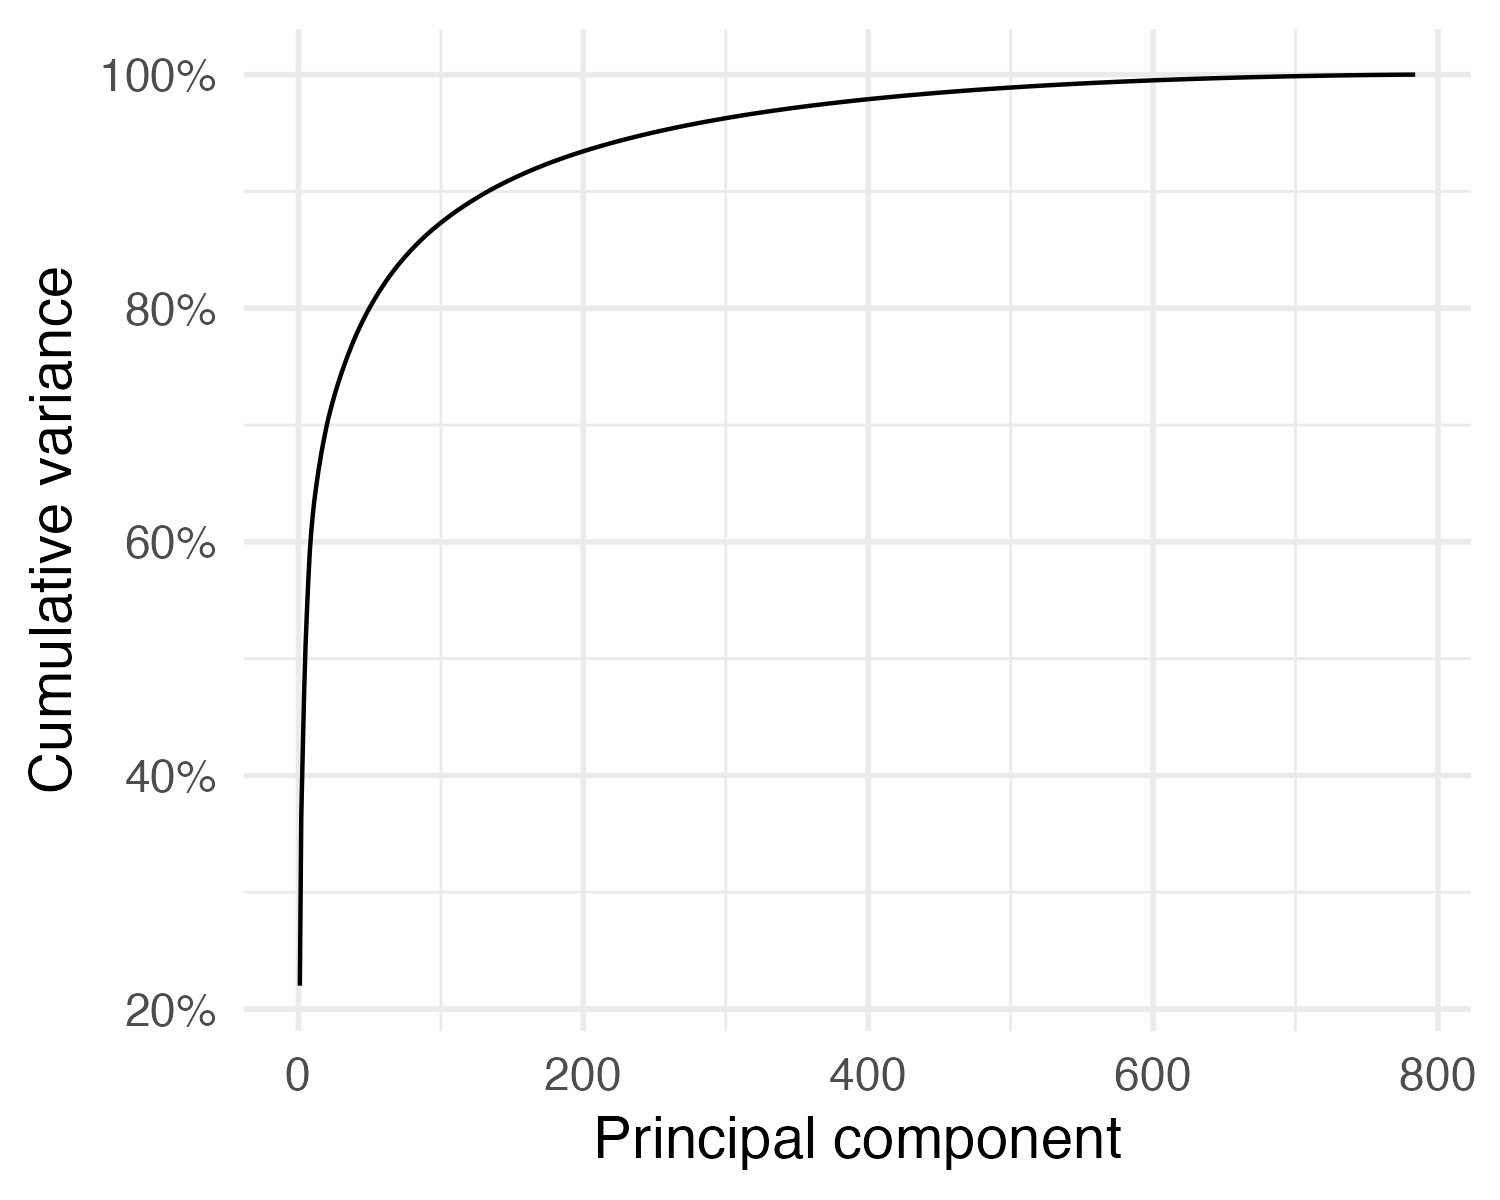
Variance explained
Uniform Manifold Approximation and Projection (UMAP)
- PCA assumes linear combinations of features
- Non-linear dimension reduction
- Looks for a low-dimensional representation of the data that preserves the structure of the data as much as possible
- Very useful for exploratory analysis (and potentially feature generation)
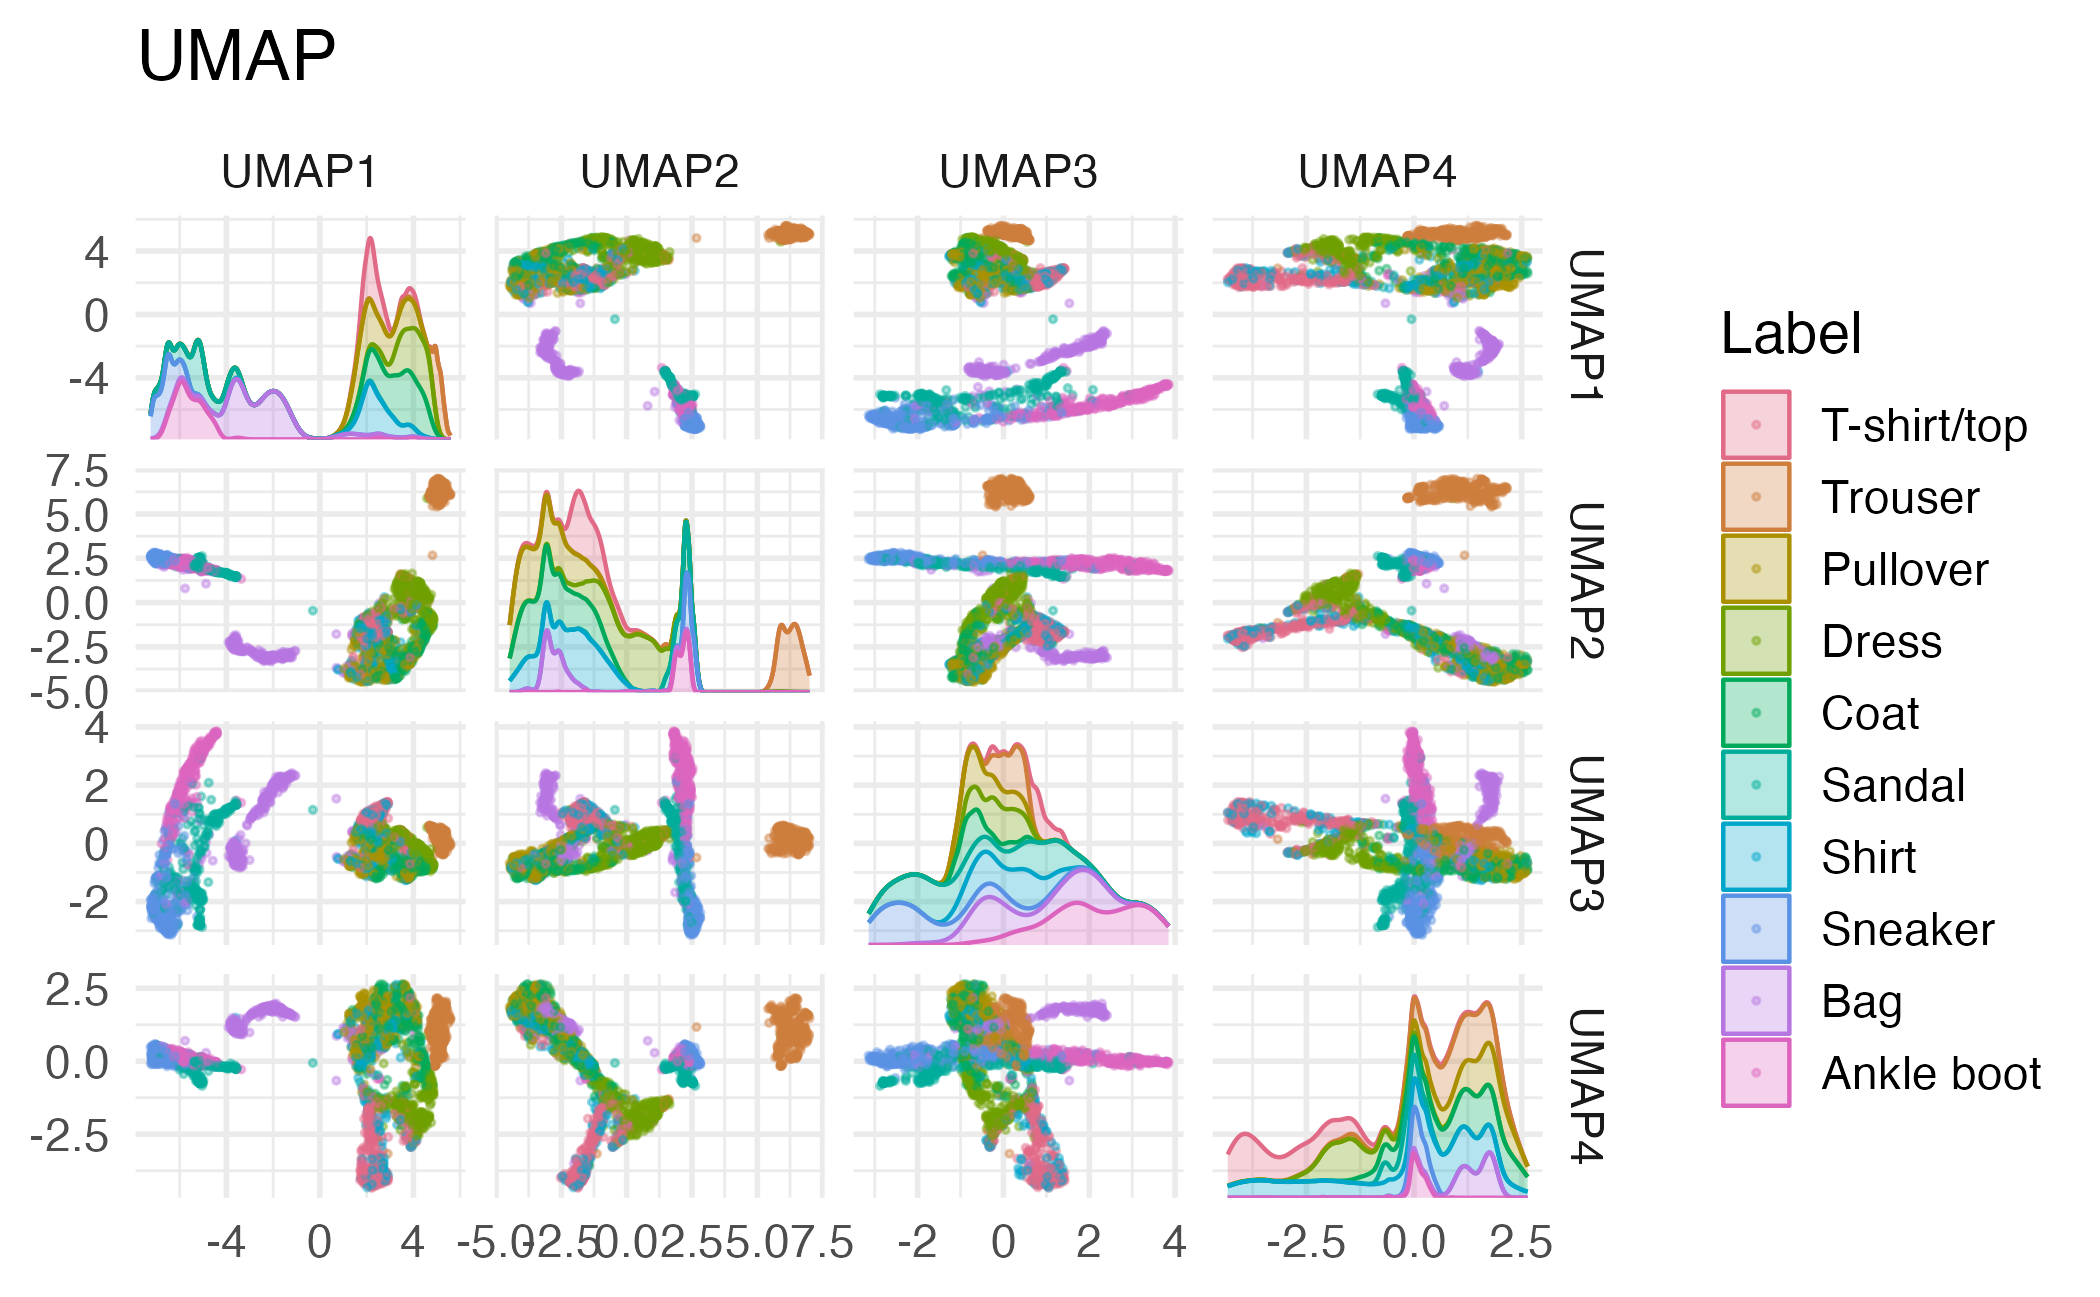
UMAP on fashion MNIST
Application exercise
ae-23
- Go to the course GitHub org and find your
ae-23(repo name will be suffixed with your GitHub name). - Clone the repo in RStudio Workbench, open the Quarto document in the repo, and follow along and complete the exercises.
- Render, commit, and push your edits by the AE deadline – end of tomorrow
Recap
- Unsupervised learning is about finding patterns/structure in data
- Dimension reduction reduce a data set from a high-dimensional space to a low-dimensional space
- Dimension reduction is useful for visualization, noise reduction, and feature generation
- PCA is a linear dimension reduction technique that finds the directions of maximum variance in the data