library(tidyverse)
library(tidymodels)
library(palmerpenguins)
library(skimr)

# drop rows with missing values
data("penguins")
penguins <- penguins |>
drop_na(flipper_length_mm, body_mass_g)Palmer Penguins and regression with a single predictor
Suggested answers
Application exercise
Answers
In this application exercise we will be studying penguins. The data can be found in the palmerpenguins package and we will use tidyverse and tidymodels for data exploration and modeling, respectively.
Please read the following context and take a skim of the data set before we get started.
This data set comprising various measurements of three different penguin species, namely Adelie, Gentoo, and Chinstrap. The rigorous study was conducted in the islands of the Palmer Archipelago, Antarctica. These data were collected from 2007 to 2009 by Dr. Kristen Gorman with the Palmer Station Long Term Ecological Research Program, part of the US Long Term Ecological Research Network. The data set is called
penguins.
skim(penguins)| Name | penguins |
| Number of rows | 342 |
| Number of columns | 8 |
| _______________________ | |
| Column type frequency: | |
| factor | 3 |
| numeric | 5 |
| ________________________ | |
| Group variables | None |
Variable type: factor
| skim_variable | n_missing | complete_rate | ordered | n_unique | top_counts |
|---|---|---|---|---|---|
| species | 0 | 1.00 | FALSE | 3 | Ade: 151, Gen: 123, Chi: 68 |
| island | 0 | 1.00 | FALSE | 3 | Bis: 167, Dre: 124, Tor: 51 |
| sex | 9 | 0.97 | FALSE | 2 | mal: 168, fem: 165 |
Variable type: numeric
| skim_variable | n_missing | complete_rate | mean | sd | p0 | p25 | p50 | p75 | p100 | hist |
|---|---|---|---|---|---|---|---|---|---|---|
| bill_length_mm | 0 | 1 | 43.92 | 5.46 | 32.1 | 39.23 | 44.45 | 48.5 | 59.6 | ▃▇▇▆▁ |
| bill_depth_mm | 0 | 1 | 17.15 | 1.97 | 13.1 | 15.60 | 17.30 | 18.7 | 21.5 | ▅▅▇▇▂ |
| flipper_length_mm | 0 | 1 | 200.92 | 14.06 | 172.0 | 190.00 | 197.00 | 213.0 | 231.0 | ▂▇▃▅▂ |
| body_mass_g | 0 | 1 | 4201.75 | 801.95 | 2700.0 | 3550.00 | 4050.00 | 4750.0 | 6300.0 | ▃▇▆▃▂ |
| year | 0 | 1 | 2008.03 | 0.82 | 2007.0 | 2007.00 | 2008.00 | 2009.0 | 2009.0 | ▇▁▇▁▇ |
Our goal is to understand better how various body measurements and attributes of penguins relate to their body mass. First, we are going to investigate the relationship between a penguins’ flipper lengths and their body masses.
Question: Based on our research focus, which variable is the response variable?
Body mass.
Demo: Visualize the relationship between flipper length and body mass of penguins.
ggplot(data = penguins,
       mapping = aes(x = flipper_length_mm, y = body_mass_g)) +
  geom_point()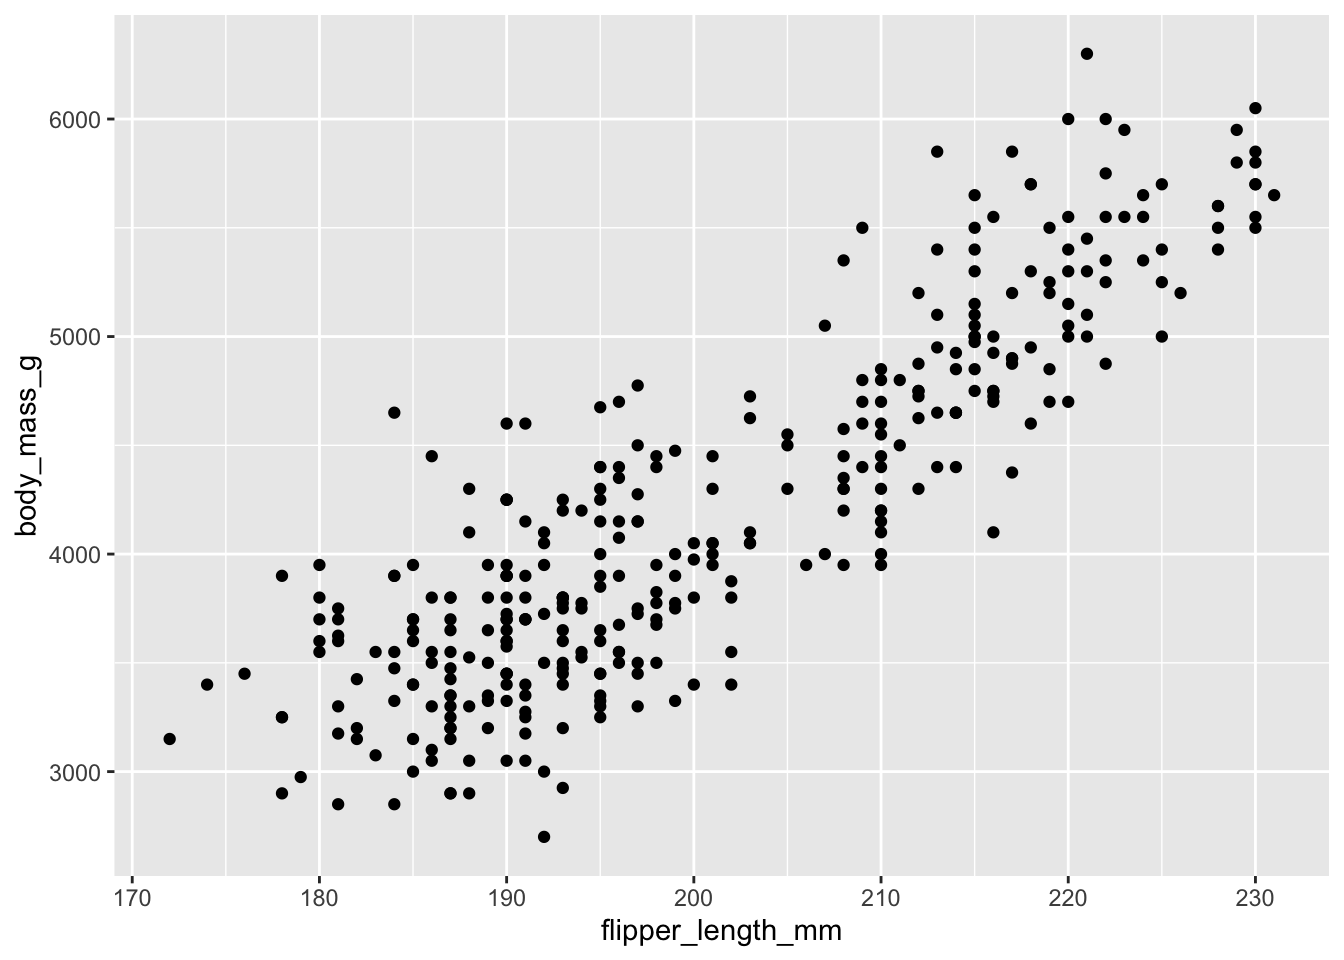
Correlation
- Demo: What is the correlation between flipper length and body mass of penguins?
# option 1
summarize(penguins, r = cor(flipper_length_mm, body_mass_g))
# A tibble: 1 × 1
r
<dbl>
1 0.871# option 2
cor(penguins$flipper_length_mm, penguins$body_mass_g)[1] 0.8712018Defining, fitting, and summarizing a model
- Demo: Write the population model below that explains the relationship between body mass and flipper length.
$$
body~mass = \beta_0 + \beta_1 \times flipper~length
$$
\[ body~mass = \beta_0 + \beta_1 \times flipper~length \]
- Demo: Fit the linear regression model and display the results. Write the estimated model output below.
Tip
Use tidy() to print the model output in a readable, tabular format.
bm_fl_fit <- linear_reg() |>
  fit(body_mass_g ~ flipper_length_mm, data = penguins)

tidy(bm_fl_fit)
# A tibble: 2 × 5
term estimate std.error statistic p.value
<chr> <dbl> <dbl> <dbl> <dbl>
1 (Intercept) -5781. 306. -18.9 5.59e- 55
2 flipper_length_mm 49.7 1.52 32.7 4.37e-107$$
\widehat{body~mass} = -5781 + 49.7 \times flipper~length
$$\[ \widehat{body~mass} = -5781 + 49.7 \times flipper~length \]
Your turn: Interpret the slope and the intercept in the context of the data.
Intercept: Penguins with 0 flipper length are expected, on average, to weigh -5,781 grams.
Slopes: For each additional millimeter of a penguin’s flipper length, the mass of the penguin is expected to be higher, on average, by 49.7 grams.
Your turn: Recreate the visualization from above, this time adding a regression line to the visualization
geom_smooth(method = "lm").
ggplot(penguins,
       aes(x = flipper_length_mm, y = body_mass_g)) +
  geom_point() +
  geom_smooth(method = "lm")
`geom_smooth()` using formula = 'y ~ x'
- Your turn: What is the estimated body mass for a penguin with a flipper length of 210?
Tip
Use predict() to generate predicted values from a fitted model. Provide the new data in a data frame as the new_data argument.
predict(bm_fl_fit, new_data = tibble(flipper_length_mm = 210))# A tibble: 1 × 1
.pred
<dbl>
1 4653.- Your turn: What is the estimated body mass for a penguin with a flipper length of 100?
But we shouldn’t do this prediction based on this model since 100 mm is outside of the range of the data (extrapolation).
predict(bm_fl_fit, new_data = tibble(flipper_length_mm = 100))# A tibble: 1 × 1
.pred
<dbl>
1 -812.Another model
- Your turn: A different researcher wants to look at body mass of penguins based on the island they were recorded on. How are the variables involved in this analysis different?
Predictor is categorical.
- Demo: Make an appropriate visualization to investigate this relationship below. Additionally, calculate the mean body mass by island.
Note
Choose a visualization appropriate for a categorical and continuous variable.
ggplot(data = penguins,
       mapping = aes(x = island, y = body_mass_g)) +
  geom_boxplot()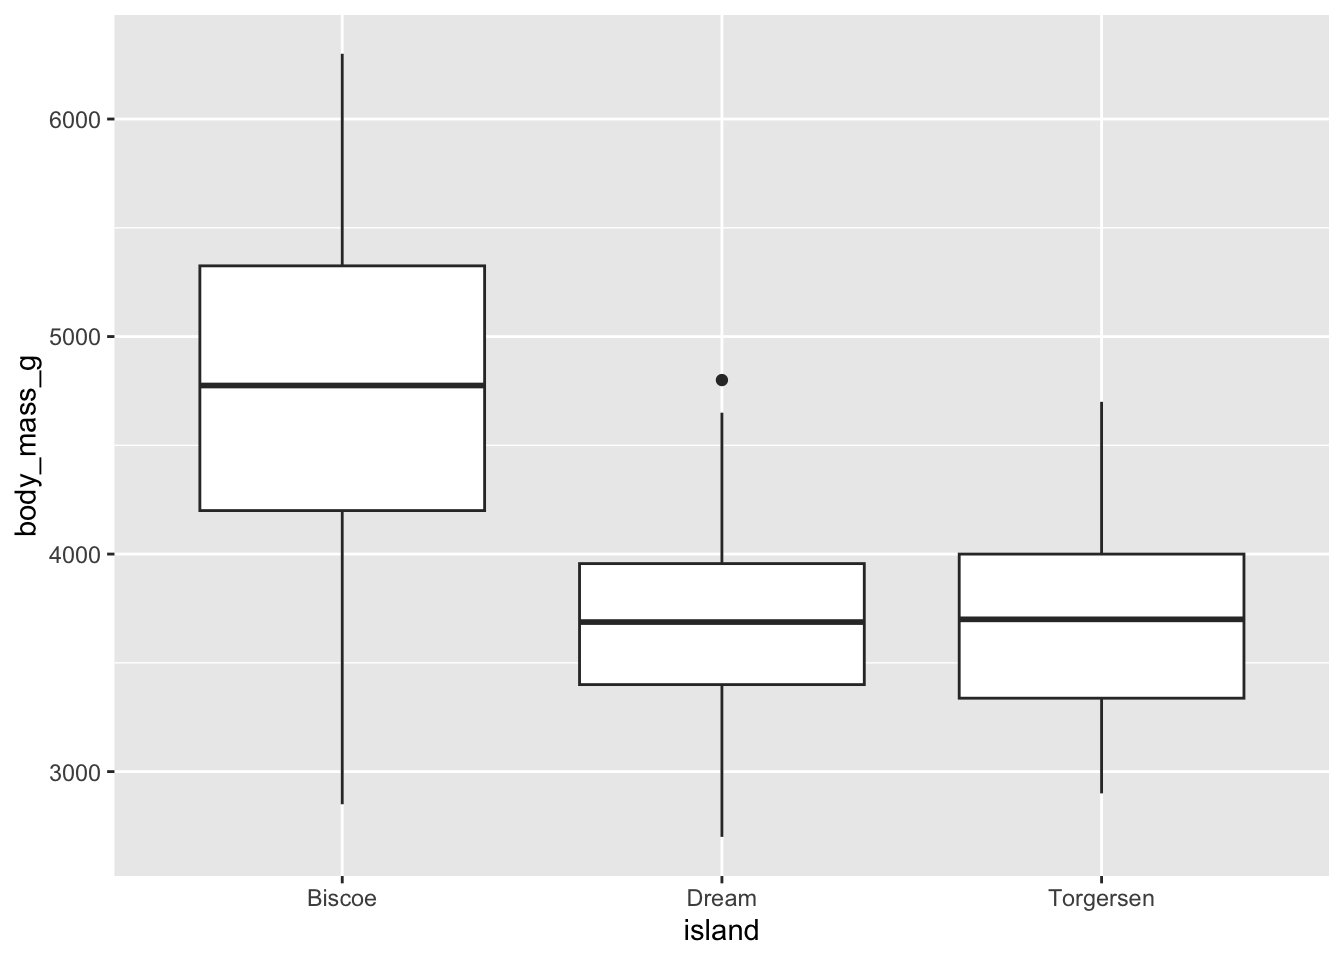
penguins |>
  group_by(island) |>
  summarize(mean_bm = mean(body_mass_g, na.rm = TRUE))
# A tibble: 3 × 2
island mean_bm
<fct> <dbl>
1 Biscoe 4716.
2 Dream 3713.
3 Torgersen 3706.- Demo: Change the geom of your previous plot to
geom_point(). Use this plot to think about how R models these data.
ggplot(penguins,
       aes(x = island, y = body_mass_g)) +
  geom_point()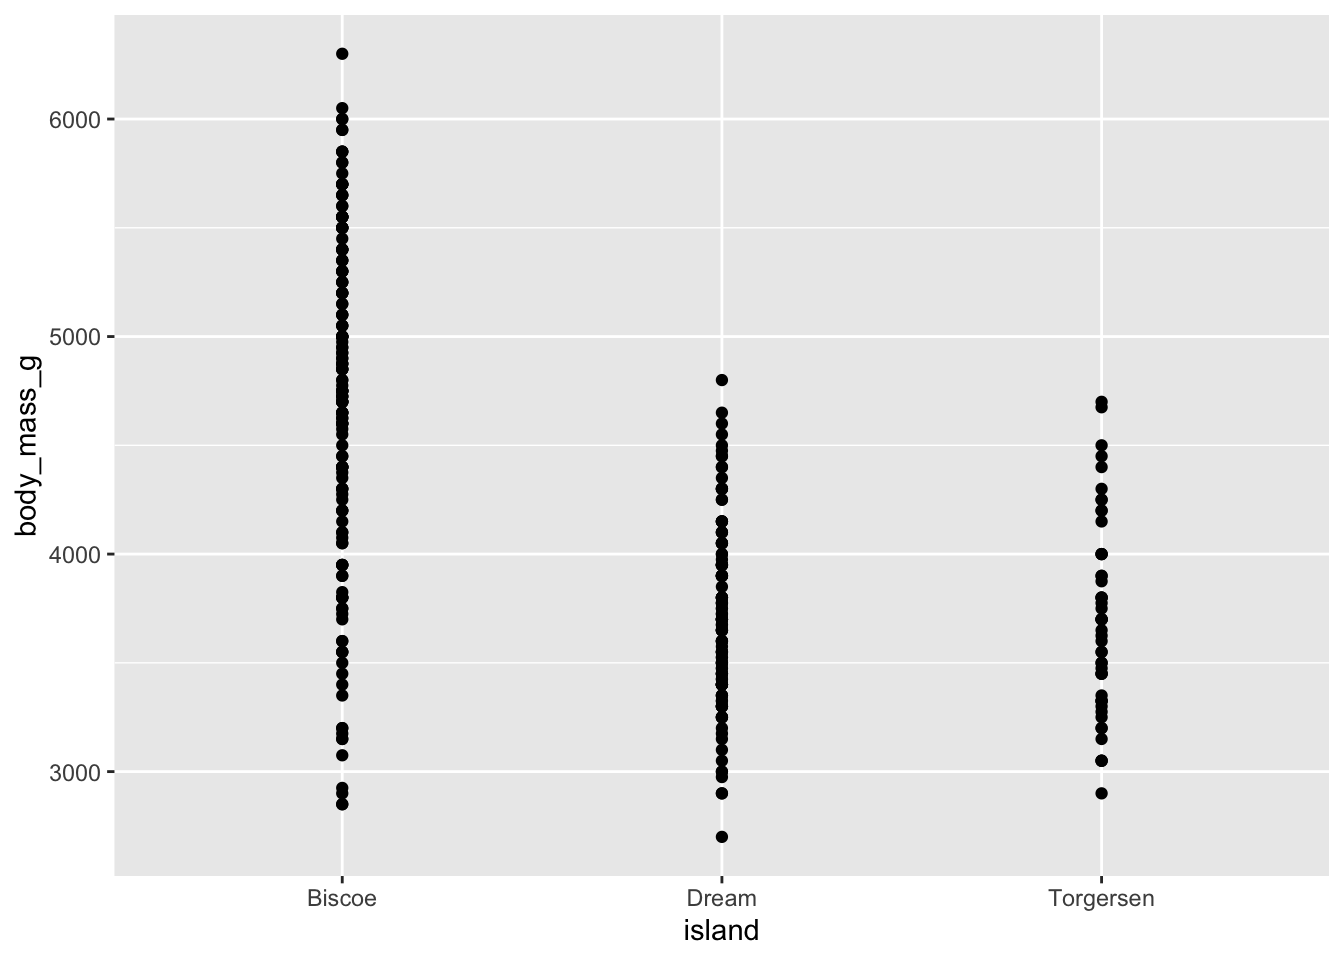
- Your turn: Fit the linear regression model and display the results. Print the estimated model output below.
bm_island_fit <- linear_reg() |>
  fit(body_mass_g ~ island, data = penguins)

tidy(bm_island_fit)
# A tibble: 3 × 5
term estimate std.error statistic p.value
<chr> <dbl> <dbl> <dbl> <dbl>
1 (Intercept) 4716. 48.5 97.3 8.93e-250
2 islandDream -1003. 74.2 -13.5 1.42e- 33
3 islandTorgersen -1010. 100. -10.1 4.66e- 21Demo: Interpret each coefficient in context of the problem.
Intercept: Penguins from Biscoe island are expected to weigh, on average, 4,716 grams.
Slopes:
Penguins from Dream island are expected to weigh, on average, 1,003 grams less than those from Biscoe island.
Penguins from Torgersen island are expected to weigh, on average, 1,010 grams less than those from Biscoe island.
Demo: What is the estimated body mass of a penguin on Biscoe island? What are the estimated body masses of penguins on Dream and Torgersen islands?
predict(bm_island_fit, new_data = tibble(island = c("Biscoe", "Dream", "Torgersen")))# A tibble: 3 × 1
.pred
<dbl>
1 4716.
2 3713.
3 3706.
Session information
sessioninfo::session_info()─ Session info ───────────────────────────────────────────────────────────────
setting value
version R version 4.3.2 (2023-10-31)
os macOS Ventura 13.5.2
system aarch64, darwin20
ui X11
language (EN)
collate en_US.UTF-8
ctype en_US.UTF-8
tz America/New_York
date 2024-03-21
pandoc 3.1.1 @ /Applications/RStudio.app/Contents/Resources/app/quarto/bin/tools/ (via rmarkdown)
─ Packages ───────────────────────────────────────────────────────────────────
package * version date (UTC) lib source
backports 1.4.1 2021-12-13 [1] CRAN (R 4.3.0)
base64enc 0.1-3 2015-07-28 [1] CRAN (R 4.3.0)
broom * 1.0.5 2023-06-09 [1] CRAN (R 4.3.0)
class 7.3-22 2023-05-03 [1] CRAN (R 4.3.2)
cli 3.6.2 2023-12-11 [1] CRAN (R 4.3.1)
codetools 0.2-19 2023-02-01 [1] CRAN (R 4.3.2)
colorspace 2.1-0 2023-01-23 [1] CRAN (R 4.3.0)
data.table 1.14.10 2023-12-08 [1] CRAN (R 4.3.1)
dials * 1.2.0 2023-04-03 [1] CRAN (R 4.3.0)
DiceDesign 1.10 2023-12-07 [1] CRAN (R 4.3.1)
digest 0.6.34 2024-01-11 [1] CRAN (R 4.3.1)
dplyr * 1.1.4 2023-11-17 [1] CRAN (R 4.3.1)
evaluate 0.23 2023-11-01 [1] CRAN (R 4.3.1)
fansi 1.0.6 2023-12-08 [1] CRAN (R 4.3.1)
farver 2.1.1 2022-07-06 [1] CRAN (R 4.3.0)
fastmap 1.1.1 2023-02-24 [1] CRAN (R 4.3.0)
forcats * 1.0.0 2023-01-29 [1] CRAN (R 4.3.0)
foreach 1.5.2 2022-02-02 [1] CRAN (R 4.3.0)
furrr 0.3.1 2022-08-15 [1] CRAN (R 4.3.0)
future 1.33.1 2023-12-22 [1] CRAN (R 4.3.1)
future.apply 1.11.1 2023-12-21 [1] CRAN (R 4.3.1)
generics 0.1.3 2022-07-05 [1] CRAN (R 4.3.0)
ggplot2 * 3.4.4 2023-10-12 [1] CRAN (R 4.3.1)
globals 0.16.2 2022-11-21 [1] CRAN (R 4.3.0)
glue 1.7.0 2024-01-09 [1] CRAN (R 4.3.1)
gower 1.0.1 2022-12-22 [1] CRAN (R 4.3.0)
GPfit 1.0-8 2019-02-08 [1] CRAN (R 4.3.0)
gtable 0.3.4 2023-08-21 [1] CRAN (R 4.3.0)
hardhat 1.3.0 2023-03-30 [1] CRAN (R 4.3.0)
here 1.0.1 2020-12-13 [1] CRAN (R 4.3.0)
hms 1.1.3 2023-03-21 [1] CRAN (R 4.3.0)
htmltools 0.5.7 2023-11-03 [1] CRAN (R 4.3.1)
htmlwidgets 1.6.4 2023-12-06 [1] CRAN (R 4.3.1)
infer * 1.0.5 2023-09-06 [1] CRAN (R 4.3.0)
ipred 0.9-14 2023-03-09 [1] CRAN (R 4.3.0)
iterators 1.0.14 2022-02-05 [1] CRAN (R 4.3.0)
jsonlite 1.8.8 2023-12-04 [1] CRAN (R 4.3.1)
knitr 1.45 2023-10-30 [1] CRAN (R 4.3.1)
labeling 0.4.3 2023-08-29 [1] CRAN (R 4.3.0)
lattice 0.21-9 2023-10-01 [1] CRAN (R 4.3.2)
lava 1.7.3 2023-11-04 [1] CRAN (R 4.3.1)
lhs 1.1.6 2022-12-17 [1] CRAN (R 4.3.0)
lifecycle 1.0.4 2023-11-07 [1] CRAN (R 4.3.1)
listenv 0.9.0 2022-12-16 [1] CRAN (R 4.3.0)
lubridate * 1.9.3 2023-09-27 [1] CRAN (R 4.3.1)
magrittr 2.0.3 2022-03-30 [1] CRAN (R 4.3.0)
MASS 7.3-60 2023-05-04 [1] CRAN (R 4.3.2)
Matrix 1.6-1.1 2023-09-18 [1] CRAN (R 4.3.2)
mgcv 1.9-0 2023-07-11 [1] CRAN (R 4.3.2)
modeldata * 1.2.0 2023-08-09 [1] CRAN (R 4.3.0)
munsell 0.5.0 2018-06-12 [1] CRAN (R 4.3.0)
nlme 3.1-163 2023-08-09 [1] CRAN (R 4.3.2)
nnet 7.3-19 2023-05-03 [1] CRAN (R 4.3.2)
palmerpenguins * 0.1.1 2022-08-15 [1] CRAN (R 4.3.0)
parallelly 1.36.0 2023-05-26 [1] CRAN (R 4.3.0)
parsnip * 1.2.0 2024-02-16 [1] CRAN (R 4.3.1)
pillar 1.9.0 2023-03-22 [1] CRAN (R 4.3.0)
pkgconfig 2.0.3 2019-09-22 [1] CRAN (R 4.3.0)
prodlim 2023.08.28 2023-08-28 [1] CRAN (R 4.3.0)
purrr * 1.0.2 2023-08-10 [1] CRAN (R 4.3.0)
R6 2.5.1 2021-08-19 [1] CRAN (R 4.3.0)
Rcpp 1.0.12 2024-01-09 [1] CRAN (R 4.3.1)
readr * 2.1.5 2024-01-10 [1] CRAN (R 4.3.1)
recipes * 1.0.9 2023-12-13 [1] CRAN (R 4.3.1)
repr 1.1.6 2023-01-26 [1] CRAN (R 4.3.0)
rlang 1.1.3 2024-01-10 [1] CRAN (R 4.3.1)
rmarkdown 2.25 2023-09-18 [1] CRAN (R 4.3.1)
rpart 4.1.21 2023-10-09 [1] CRAN (R 4.3.2)
rprojroot 2.0.4 2023-11-05 [1] CRAN (R 4.3.1)
rsample * 1.2.0 2023-08-23 [1] CRAN (R 4.3.0)
rstudioapi 0.15.0 2023-07-07 [1] CRAN (R 4.3.0)
scales * 1.2.1 2024-01-18 [1] Github (r-lib/scales@c8eb772)
sessioninfo 1.2.2 2021-12-06 [1] CRAN (R 4.3.0)
skimr * 2.1.5 2022-12-23 [1] CRAN (R 4.3.0)
stringi 1.8.3 2023-12-11 [1] CRAN (R 4.3.1)
stringr * 1.5.1 2023-11-14 [1] CRAN (R 4.3.1)
survival 3.5-7 2023-08-14 [1] CRAN (R 4.3.2)
tibble * 3.2.1 2023-03-20 [1] CRAN (R 4.3.0)
tidymodels * 1.1.1 2023-08-24 [1] CRAN (R 4.3.0)
tidyr * 1.3.0 2023-01-24 [1] CRAN (R 4.3.0)
tidyselect 1.2.0 2022-10-10 [1] CRAN (R 4.3.0)
tidyverse * 2.0.0 2023-02-22 [1] CRAN (R 4.3.0)
timechange 0.2.0 2023-01-11 [1] CRAN (R 4.3.0)
timeDate 4032.109 2023-12-14 [1] CRAN (R 4.3.1)
tune * 1.1.2 2023-08-23 [1] CRAN (R 4.3.0)
tzdb 0.4.0 2023-05-12 [1] CRAN (R 4.3.0)
utf8 1.2.4 2023-10-22 [1] CRAN (R 4.3.1)
vctrs 0.6.5 2023-12-01 [1] CRAN (R 4.3.1)
withr 2.5.2 2023-10-30 [1] CRAN (R 4.3.1)
workflows * 1.1.4 2024-02-19 [1] CRAN (R 4.3.1)
workflowsets * 1.0.1 2023-04-06 [1] CRAN (R 4.3.0)
xfun 0.41 2023-11-01 [1] CRAN (R 4.3.1)
yaml 2.3.8 2023-12-11 [1] CRAN (R 4.3.1)
yardstick * 1.3.0 2024-01-19 [1] CRAN (R 4.3.1)
[1] /Library/Frameworks/R.framework/Versions/4.3-arm64/Resources/library
──────────────────────────────────────────────────────────────────────────────