library(tidyverse)
library(scales)

# set default seed and theme
set.seed(123)
theme_set(theme_minimal())Obtaining World Bank indicators
Tutorial
Application programming interface
World Bank
Use the wbstats package to access the World Bank API.
The World Bank contains a rich and detailed set of socioeconomic indicators spanning several decades and dozens of topics. Their data is available for bulk download as CSV files from their website. However, frequently you only need to obtain a handful of indicators or a subset of countries.
To provide more granular access to this information, the World Bank provides a RESTful API for querying and obtaining a portion of their database programmatically. The wbstats implements this API in R to allow for relatively easy access to the API and return the results in a tidy data frame.
Finding available data with wb_cachelist
wb_cachelist contains a snapshot of available countries, indicators, and other relevant information obtainable through the WB API.
library(wbstats)

str(wb_cachelist, max.level = 1)
List of 8
$ countries : tibble [304 × 18] (S3: tbl_df/tbl/data.frame)
$ indicators : tibble [16,649 × 8] (S3: tbl_df/tbl/data.frame)
$ sources : tibble [63 × 9] (S3: tbl_df/tbl/data.frame)
$ topics : tibble [21 × 3] (S3: tbl_df/tbl/data.frame)
$ regions : tibble [48 × 4] (S3: tbl_df/tbl/data.frame)
$ income_levels: tibble [7 × 3] (S3: tbl_df/tbl/data.frame)
$ lending_types: tibble [4 × 3] (S3: tbl_df/tbl/data.frame)
$ languages : tibble [23 × 3] (S3: tbl_df/tbl/data.frame)glimpse(wb_cachelist$countries)Rows: 304
Columns: 18
$ iso3c <chr> "ABW", "AFG", "AFR", "AGO", "ALB", "AND", "ANR", "A…
$ iso2c <chr> "AW", "AF", "A9", "AO", "AL", "AD", "L5", "1A", "AE…
$ country <chr> "Aruba", "Afghanistan", "Africa", "Angola", "Albani…
$ capital_city <chr> "Oranjestad", "Kabul", NA, "Luanda", "Tirane", "And…
$ longitude <dbl> -70.01670, 69.17610, NA, 13.24200, 19.81720, 1.5218…
$ latitude <dbl> 12.51670, 34.52280, NA, -8.81155, 41.33170, 42.5075…
$ region_iso3c <chr> "LCN", "SAS", NA, "SSF", "ECS", "ECS", NA, NA, "MEA…
$ region_iso2c <chr> "ZJ", "8S", NA, "ZG", "Z7", "Z7", NA, NA, "ZQ", "ZJ…
$ region <chr> "Latin America & Caribbean", "South Asia", "Aggrega…
$ admin_region_iso3c <chr> NA, "SAS", NA, "SSA", "ECA", NA, NA, NA, NA, "LAC",…
$ admin_region_iso2c <chr> NA, "8S", NA, "ZF", "7E", NA, NA, NA, NA, "XJ", "7E…
$ admin_region <chr> NA, "South Asia", NA, "Sub-Saharan Africa (excludin…
$ income_level_iso3c <chr> "HIC", "LIC", NA, "LMC", "UMC", "HIC", NA, NA, "HIC…
$ income_level_iso2c <chr> "XD", "XM", NA, "XN", "XT", "XD", NA, NA, "XD", "XT…
$ income_level <chr> "High income", "Low income", "Aggregates", "Lower m…
$ lending_type_iso3c <chr> "LNX", "IDX", NA, "IBD", "IBD", "LNX", NA, NA, "LNX…
$ lending_type_iso2c <chr> "XX", "XI", NA, "XF", "XF", "XX", NA, NA, "XX", "XF…
$ lending_type <chr> "Not classified", "IDA", "Aggregates", "IBRD", "IBR…Search available data with wb_search()
wb_search() searches through the wb_cachelist$indicators data frame to find indicators that match the search pattern.1
wb_search("unemployment")# A tibble: 61 × 3
indicator_id indicator indicator_desc
<chr> <chr> <chr>
1 fin37.t.a Received government transfers in the past year (… The percentag…
2 fin37.t.a.1 Received government transfers in the past year, … The percentag…
3 fin37.t.a.10 Received government transfers in the past year, … The percentag…
4 fin37.t.a.11 Received government transfers in the past year, … The percentag…
5 fin37.t.a.2 Received government transfers in the past year, … The percentag…
6 fin37.t.a.3 Received government transfers in the past year, … The percentag…
7 fin37.t.a.4 Received government transfers in the past year, … The percentag…
8 fin37.t.a.5 Received government transfers in the past year, … The percentag…
9 fin37.t.a.6 Received government transfers in the past year, … The percentag…
10 fin37.t.a.7 Received government transfers in the past year, … The percentag…
# ℹ 51 more rowswb_search("labor force")# A tibble: 245 × 3
indicator_id indicator indicator_desc
<chr> <chr> <chr>
1 9.0.Employee.All Employees (%) Share of the …
2 9.0.Employee.B40 Employees-Bottom 40 Percent (%) Share of the …
3 9.0.Employee.T60 Employees-Top 60 Percent (%) Share of the …
4 9.0.Employer.All Employers (%) Share of the …
5 9.0.Employer.B40 Employers-Bottom 40 Percent (%) Share of the …
6 9.0.Employer.T60 Employers-Top 60 Percent (%) Share of the …
7 9.0.Labor.All Labor Force Participation Rate (%) Share of the …
8 9.0.Labor.B40 Labor Force Participation Rate (%)-Bottom 40… Share of the …
9 9.0.Labor.T60 Labor Force Participation Rate (%)-Top 60 Pe… Share of the …
10 9.0.SelfEmp.All Self-Employed (%) Share of the …
# ℹ 235 more rowswb_search("labor force", fields = "indicator") # limit search to just the indicator name# A tibble: 176 × 3
indicator_id indicator indicator_desc
<chr> <chr> <chr>
1 9.0.Labor.All Labor Force Participation Rate (%) Share of the …
2 9.0.Labor.B40 Labor Force Participation Rate (%)-Bottom 40 P… Share of the …
3 9.0.Labor.T60 Labor Force Participation Rate (%)-Top 60 Perc… Share of the …
4 9.1.Labor.All Labor Force Participation Rate (%), Male Share of the …
5 9.1.Labor.B40 Labor Force Participation Rate (%)-Bottom 40 P… Share of the …
6 9.1.Labor.T60 Labor Force Participation Rate (%)-Top 60 Perc… Share of the …
7 9.2.Labor.All Labor Force Participation Rate (%), Female Share of the …
8 9.2.Labor.B40 Labor Force Participation Rate (%)-Bottom 40 P… Share of the …
9 9.2.Labor.T60 Labor Force Participation Rate (%)-Top 60 Perc… Share of the …
10 account.t.d.10 Account, in labor force (% age 15+) The percentag…
# ℹ 166 more rowsDownloading data with wb_data()
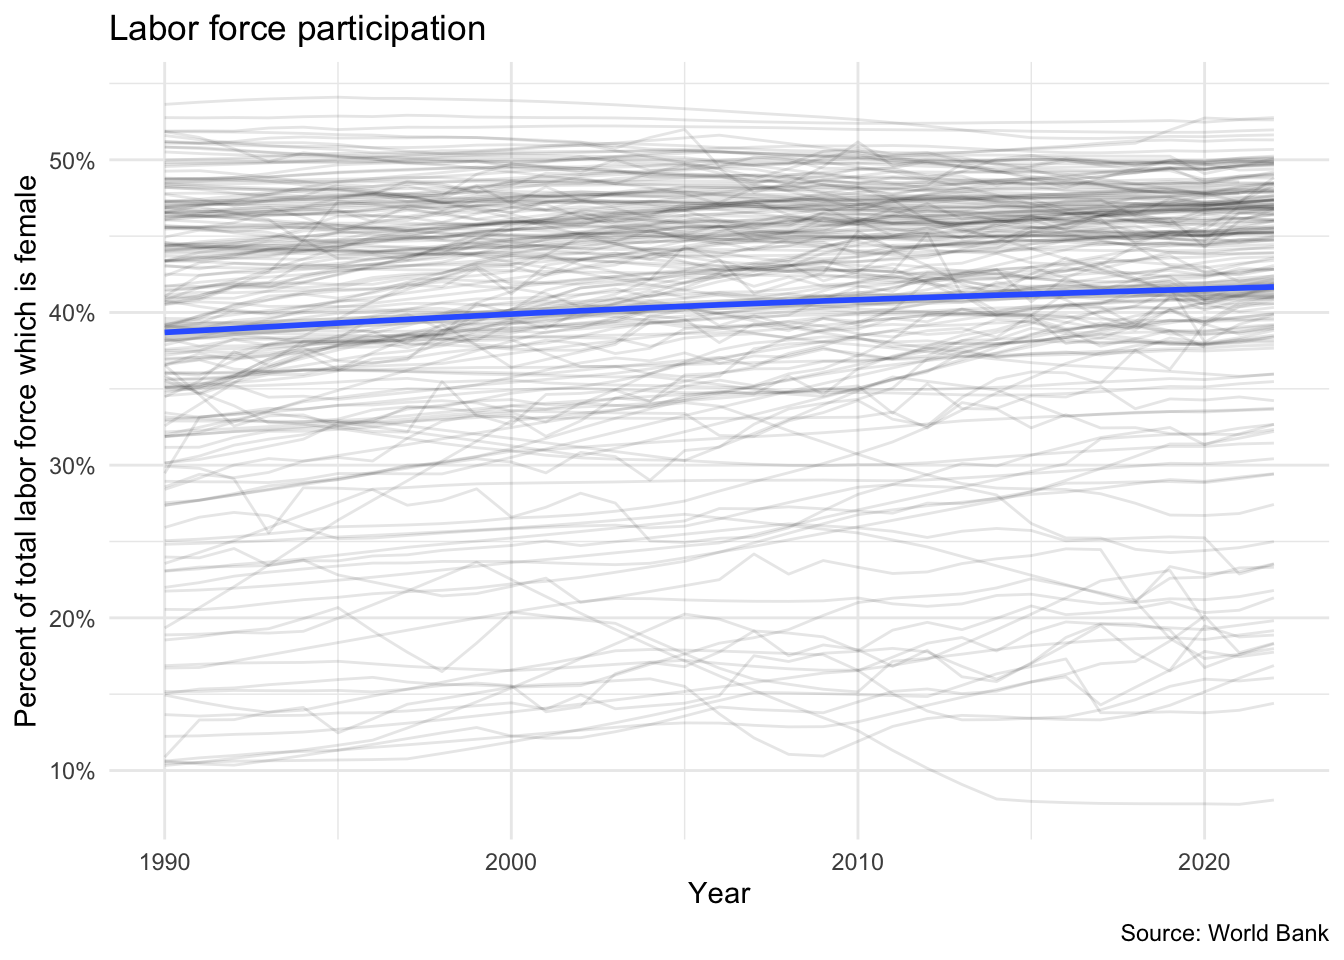
Once you have the set of indicators you would like to obtain, you can use the wb_data() function to generate the API query and download the results. Let’s say we want to obtain information on the percent of females participating in the labor force. The indicator ID is SL.TLF.TOTL.FE.ZS. We can download the indicator for all countries from 1990-2022 using:
female_labor <- wb_data(
  indicator = "SL.TLF.TOTL.FE.ZS",
  start_date = 1990,
  end_date = 2022
)
female_labor
# A tibble: 7,161 × 9
iso2c iso3c country date SL.TLF.TOTL.FE.ZS unit obs_status footnote
<chr> <chr> <chr> <dbl> <dbl> <chr> <chr> <chr>
1 AW ABW Aruba 1990 NA <NA> <NA> <NA>
2 AW ABW Aruba 1991 NA <NA> <NA> <NA>
3 AW ABW Aruba 1992 NA <NA> <NA> <NA>
4 AW ABW Aruba 1993 NA <NA> <NA> <NA>
5 AW ABW Aruba 1994 NA <NA> <NA> <NA>
6 AW ABW Aruba 1995 NA <NA> <NA> <NA>
7 AW ABW Aruba 1996 NA <NA> <NA> <NA>
8 AW ABW Aruba 1997 NA <NA> <NA> <NA>
9 AW ABW Aruba 1998 NA <NA> <NA> <NA>
10 AW ABW Aruba 1999 NA <NA> <NA> <NA>
# ℹ 7,151 more rows
# ℹ 1 more variable: last_updated <date>Note the column containing our indicator uses the indicator ID as its name. This is rather un-intuitive, so we can adjust it directly in the function.
female_labor <- wb_data(
  indicator = c("fem_lab_part" = "SL.TLF.TOTL.FE.ZS"),
  start_date = 1990,
  end_date = 2022
)
female_labor
# A tibble: 7,161 × 9
iso2c iso3c country date fem_lab_part unit obs_status footnote last_updated
<chr> <chr> <chr> <dbl> <dbl> <chr> <chr> <chr> <date>
1 AW ABW Aruba 1990 NA <NA> <NA> <NA> 2023-12-18
2 AW ABW Aruba 1991 NA <NA> <NA> <NA> 2023-12-18
3 AW ABW Aruba 1992 NA <NA> <NA> <NA> 2023-12-18
4 AW ABW Aruba 1993 NA <NA> <NA> <NA> 2023-12-18
5 AW ABW Aruba 1994 NA <NA> <NA> <NA> 2023-12-18
6 AW ABW Aruba 1995 NA <NA> <NA> <NA> 2023-12-18
7 AW ABW Aruba 1996 NA <NA> <NA> <NA> 2023-12-18
8 AW ABW Aruba 1997 NA <NA> <NA> <NA> 2023-12-18
9 AW ABW Aruba 1998 NA <NA> <NA> <NA> 2023-12-18
10 AW ABW Aruba 1999 NA <NA> <NA> <NA> 2023-12-18
# ℹ 7,151 more rowsggplot(data = female_labor, mapping = aes(x = date, y = fem_lab_part)) +
geom_line(mapping = aes(group = country), alpha = .1) +
geom_smooth() +
scale_y_continuous(labels = percent_format(scale = 1)) +
labs(
title = "Labor force participation",
x = "Year",
y = "Percent of total labor force which is female",
caption = "Source: World Bank"
)
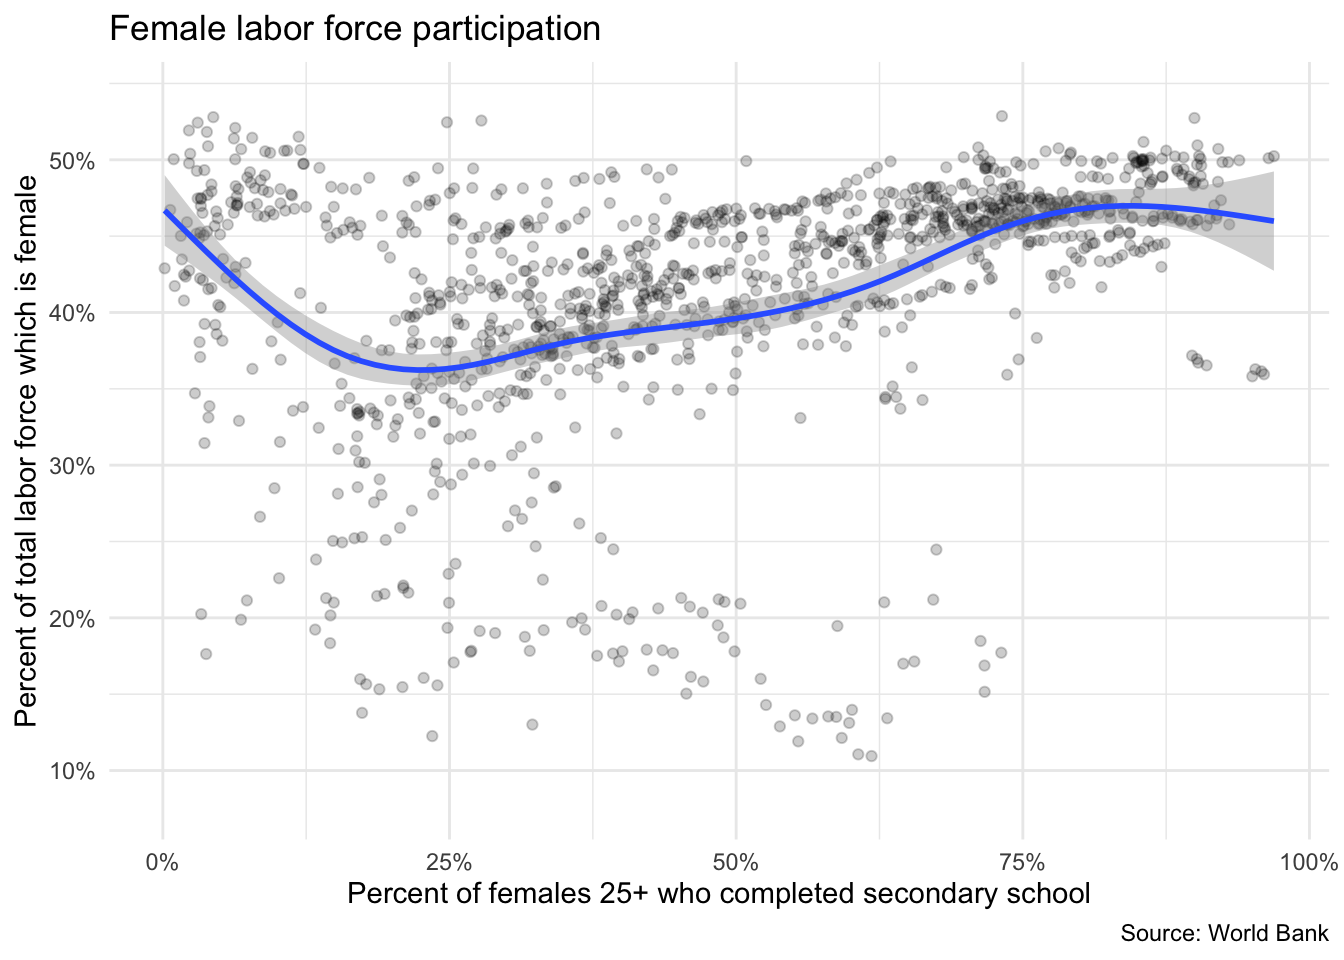
By default, wb_data() returns queries as data frames in a wide format. So if we request multiple indicators, each indicator will be stored in its own column.
female_vars <- wb_data(
  indicator = c(
    "fem_lab_part" = "SL.TLF.TOTL.FE.ZS",
    "fem_educ_sec" = "SE.SEC.CUAT.UP.FE.ZS"
  ),
  start_date = 1990,
  end_date = 2022
)

ggplot(data = female_vars, mapping = aes(x = fem_educ_sec, y = fem_lab_part)) +
  geom_point(alpha = .2) +
  geom_smooth() +
  scale_x_continuous(labels = label_percent(scale = 1)) +
  scale_y_continuous(labels = label_percent(scale = 1)) +
  labs(
    title = "Female labor force participation",
    x = "Percent of females 25+ who completed secondary school",
    y = "Percent of total labor force which is female",
    caption = "Source: World Bank"
  )
Session information
sessioninfo::session_info()─ Session info ───────────────────────────────────────────────────────────────
setting value
version R version 4.3.1 (2023-06-16)
os macOS Ventura 13.5.2
system aarch64, darwin20
ui X11
language (EN)
collate en_US.UTF-8
ctype en_US.UTF-8
tz America/New_York
date 2024-01-05
pandoc 3.1.1 @ /Applications/RStudio.app/Contents/Resources/app/quarto/bin/tools/ (via rmarkdown)
─ Packages ───────────────────────────────────────────────────────────────────
package * version date (UTC) lib source
cli 3.6.2 2023-12-11 [1] CRAN (R 4.3.1)
codetools 0.2-19 2023-02-01 [1] CRAN (R 4.3.0)
colorspace 2.1-0 2023-01-23 [1] CRAN (R 4.3.0)
curl 5.2.0 2023-12-08 [1] CRAN (R 4.3.1)
digest 0.6.33 2023-07-07 [1] CRAN (R 4.3.0)
dplyr * 1.1.4 2023-11-17 [1] CRAN (R 4.3.1)
evaluate 0.23 2023-11-01 [1] CRAN (R 4.3.1)
fansi 1.0.6 2023-12-08 [1] CRAN (R 4.3.1)
farver 2.1.1 2022-07-06 [1] CRAN (R 4.3.0)
fastmap 1.1.1 2023-02-24 [1] CRAN (R 4.3.0)
forcats * 1.0.0 2023-01-29 [1] CRAN (R 4.3.0)
generics 0.1.3 2022-07-05 [1] CRAN (R 4.3.0)
ggplot2 * 3.4.4 2023-10-12 [1] CRAN (R 4.3.1)
glue 1.6.2 2022-02-24 [1] CRAN (R 4.3.0)
gtable 0.3.4 2023-08-21 [1] CRAN (R 4.3.0)
here 1.0.1 2020-12-13 [1] CRAN (R 4.3.0)
hms 1.1.3 2023-03-21 [1] CRAN (R 4.3.0)
htmltools 0.5.7 2023-11-03 [1] CRAN (R 4.3.1)
htmlwidgets 1.6.4 2023-12-06 [1] CRAN (R 4.3.1)
httr 1.4.7 2023-08-15 [1] CRAN (R 4.3.0)
jsonlite 1.8.8 2023-12-04 [1] CRAN (R 4.3.1)
knitr 1.45 2023-10-30 [1] CRAN (R 4.3.1)
labeling 0.4.3 2023-08-29 [1] CRAN (R 4.3.0)
lattice 0.22-5 2023-10-24 [1] CRAN (R 4.3.1)
lifecycle 1.0.4 2023-11-07 [1] CRAN (R 4.3.1)
lubridate * 1.9.3 2023-09-27 [1] CRAN (R 4.3.1)
magrittr 2.0.3 2022-03-30 [1] CRAN (R 4.3.0)
Matrix 1.6-4 2023-11-30 [1] CRAN (R 4.3.1)
mgcv 1.9-0 2023-07-11 [1] CRAN (R 4.3.0)
munsell 0.5.0 2018-06-12 [1] CRAN (R 4.3.0)
nlme 3.1-164 2023-11-27 [1] CRAN (R 4.3.1)
pillar 1.9.0 2023-03-22 [1] CRAN (R 4.3.0)
pkgconfig 2.0.3 2019-09-22 [1] CRAN (R 4.3.0)
purrr * 1.0.2 2023-08-10 [1] CRAN (R 4.3.0)
R6 2.5.1 2021-08-19 [1] CRAN (R 4.3.0)
readr * 2.1.4 2023-02-10 [1] CRAN (R 4.3.0)
rlang 1.1.2 2023-11-04 [1] CRAN (R 4.3.1)
rmarkdown 2.25 2023-09-18 [1] CRAN (R 4.3.1)
rprojroot 2.0.4 2023-11-05 [1] CRAN (R 4.3.1)
rstudioapi 0.15.0 2023-07-07 [1] CRAN (R 4.3.0)
scales * 1.3.0 2023-11-28 [1] CRAN (R 4.3.1)
sessioninfo 1.2.2 2021-12-06 [1] CRAN (R 4.3.0)
stringi 1.8.3 2023-12-11 [1] CRAN (R 4.3.1)
stringr * 1.5.1 2023-11-14 [1] CRAN (R 4.3.1)
tibble * 3.2.1 2023-03-20 [1] CRAN (R 4.3.0)
tidyr * 1.3.0 2023-01-24 [1] CRAN (R 4.3.0)
tidyselect 1.2.0 2022-10-10 [1] CRAN (R 4.3.0)
tidyverse * 2.0.0 2023-02-22 [1] CRAN (R 4.3.0)
timechange 0.2.0 2023-01-11 [1] CRAN (R 4.3.0)
tzdb 0.4.0 2023-05-12 [1] CRAN (R 4.3.0)
utf8 1.2.4 2023-10-22 [1] CRAN (R 4.3.1)
vctrs 0.6.5 2023-12-01 [1] CRAN (R 4.3.1)
wbstats * 1.0.4 2020-12-05 [1] CRAN (R 4.3.0)
withr 2.5.2 2023-10-30 [1] CRAN (R 4.3.1)
xfun 0.41 2023-11-01 [1] CRAN (R 4.3.1)
yaml 2.3.8 2023-12-11 [1] CRAN (R 4.3.1)
[1] /Library/Frameworks/R.framework/Versions/4.3-arm64/Resources/library
──────────────────────────────────────────────────────────────────────────────Footnotes
Alternatively, you can use the web interface to determine specific indicators and their IDs.↩︎